EX-99.1
Published on September 9, 2026
DRAFT • STRICTLY PRIVATE AND CONFIDENTIAL 1 Investor Presentation September 2026 Commercial banking • SBA lending • Gaming FinTech & payments GBank Financial Holdings Inc. • Nasdaq: GBFH A diversified banking platform built for disciplined growth.
Disclaimers This presentation contains, and future oral and written statements of GBank Financial Holdings Inc. (the “Company,” “we,” “us” or “our”) and its management may contain, forward-looking statements. Forward-looking statements are neither historical facts nor guarantees or assurances of future performance. Instead, they are based only on our current expectations and assumptions regarding the future of our business, future plans and strategies, projections, anticipated events and trends, the economy and other future conditions. Forward-looking statements involve risks and uncertainties and can be identified by words such as “believes,” “anticipates,” “expects,” “forecast,” “guidance,” “intends,” “targeted,” “continue,” “remain,” “should,” “may,” “plans,” “estimates,” “will,” “will continue,” “will remain,” variations on such words or phrases, or similar references to future occurrences or events in future periods; however, such words are not the exclusive means of identifying such statements. Examples of forward-looking statements include but are not limited to: (i) projections of revenues, expenses, income or loss, earnings or loss per share, and other financial items; (ii) statements of plans, objectives, and expectations of the Company or our management or board of directors; (iii) statements of future economic performance; and (iv) statements of assumptions underlying such statements. Forward-looking statements are based on the Company’s current expectations and assumptions regarding the future of its business, future plans and strategies, projections, anticipated events and trends, the economy, and other future conditions. Because forward-looking statements relate to the future, they are subject to inherent uncertainties, risks, and changes in circumstances that are difficult to predict. The Company’s actual results may differ materially from those contemplated by the forward-looking statements. Factors that could cause actual results to differ from those discussed in the forward-looking statements include, but are not limited to: (1) local, regional, national, and international economic conditions and the impact they may have on us and our customers and our assessment of that impact; (2) the impact of the COVID-19 pandemic on our business, including the impact of actions taken by governmental and regulatory authorities in response to such pandemic, such as the CARES Act and the programs established thereunder, and our participation in such programs; (3) volatility and disruption in national and international financial markets; (4) government intervention in the U.S. financial system, whether through changes in the discount rate or money supply or otherwise; (5) changes in the level of non-performing assets and charge-offs; (6) changes in estimates of future reserve requirements based upon the periodic review thereof under relevant regulatory and accounting requirements; (7) adverse conditions in the securities markets that lead to impairment in the value of securities in our investment portfolio; (8) inflation, deflation, changes in market interest rates, developments in the securities market, and monetary fluctuations; (9) the timely development and acceptance of new products and services and perceived overall value of these products and services by customers; (10) changes in consumer spending, borrowings, and savings habits; (11) technological changes and the ability to develop and maintain secure and reliable electronic systems; (12) the ability to increase market share and control expenses; (13) changes in the competitive environment among banks, bank holding companies, and other financial service providers; (14) the effect of changes in laws and regulations (including laws and regulations concerning taxes, banking, securities, and insurance) with which we and our subsidiaries must comply; (15) the effect of changes in accounting policies and practices, as may be adopted by the regulatory agencies, as well as the Financial Accounting Standards Board, and other accounting standard setters; (16) the costs and effects of legal and regulatory developments including the resolution of legal proceedings; (17) the loss of key executives or employees; (18) the economic impact of past and any future terrorist threats and attacks and any acts of war or threats thereof; (19) unexpected results of acquisitions; and (20) our success at managing the risks involved in the foregoing items. These and other risks and uncertainties detailed in the Company's periodic reports filed with the Securities and Exchange Commission, including its Form 10-Q for the quarter ended June 30, 2026, and its last earnings press release could cause actual results to differ materially from those expressed or implied in any forward-looking statements. Any forward-looking statement made by the Company in this presentation is based only on information currently available to us and speaks only as of the date on which it is made. The Company undertakes no obligation to publicly update any forward-looking statement, whether as a result of new information, future developments or otherwise, except as may be required by law. This presentation has been prepared by the Company solely for informational purposes and is being furnished on a confidential basis to a limited number of institutional accredited investors, as defined in Rule 501(a)(1),(3),(7) or (9) of Regulation D promulgated under the Securities Act, and qualified institutional buyers, as defined in Rule 144A under the Securities Act. This presentation does not constitute or form part of any offer or invitation to sell or issue, or any solicitation of any offer to purchase or subscribe for, any securities of the Company. This presentation does not purport to contain all of the information that you should consider before investing in securities of the Company and should not be construed as investment, legal, regulatory or tax advice. Each potential investor should make such investigations as it deems necessary to arrive at an independent evaluation of an investment in the securities of the Company and should consult its own legal counsel and financial, accounting, regulatory and tax advisors to determine the consequences of such an investment prior to making an investment decision and should not rely on any information set forth in this presentation. The information in this presentation may not be reproduced or redistributed, passed on or divulged, directly or indirectly, to any other person. The Company reserves the right to request the return of this presentation at any time. The receipt of this presentation does not create, nor is it intended to create, a binding and enforceable contract or commitment between the Company and any other party, and this presentation may not be relied upon by any party as the basis for a contract or commitment to purchase the securities of the Company. Any purchase and sale of the securities of the Company will be governed solely by a purchase agreement, and the information contained herein will be superseded in its entirety by such purchase agreement. In the event that any information contained in this presentation is inconsistent with or contrary to any of the terms and conditions of the purchase agreement, the purchase agreement shall control. Each potential investor should review the purchase agreement prior to making an investment decision. The securities of the Company mentioned in this presentation will not be registered for resale and will be subject to significant restrictions and limitations on transferability and liquidity. Investment in the securities of the Company involves a high degree of risk. Only potential investors who can bear the risk of an unregistered illiquid investment should consider investment in the securities of the Company. Certain of the information contained herein may be derived from information provided by industry sources. The Company believes that such information is accurate and that the sources from which it has been obtained are reliable. However, the Company has not independently verified such information and cannot guarantee the accuracy of such information. This presentation contains certain pro forma and projected information, including projected pro forma information that reflects the Company’s current expectations and assumptions. This pro forma information does not purport to present the results that the Company will ultimately realize. This presentation includes certain measures that are not calculated under U.S. generally accepted accounting principles (“GAAP”). These non-GAAP financial measures should be considered only as supplemental to, and not superior to, financial measures prepared in accordance with GAAP. SECURITIES NOT INSURED. The securities mentioned in this presentation are not savings or deposit accounts and are not insured by the Federal Deposit Insurance Corporation or by any other government agency. 2 For purposes of this presentation, MRQ = Most Recent Quarter, LTM = Last Twelve Months, and YTD = Year to Date.
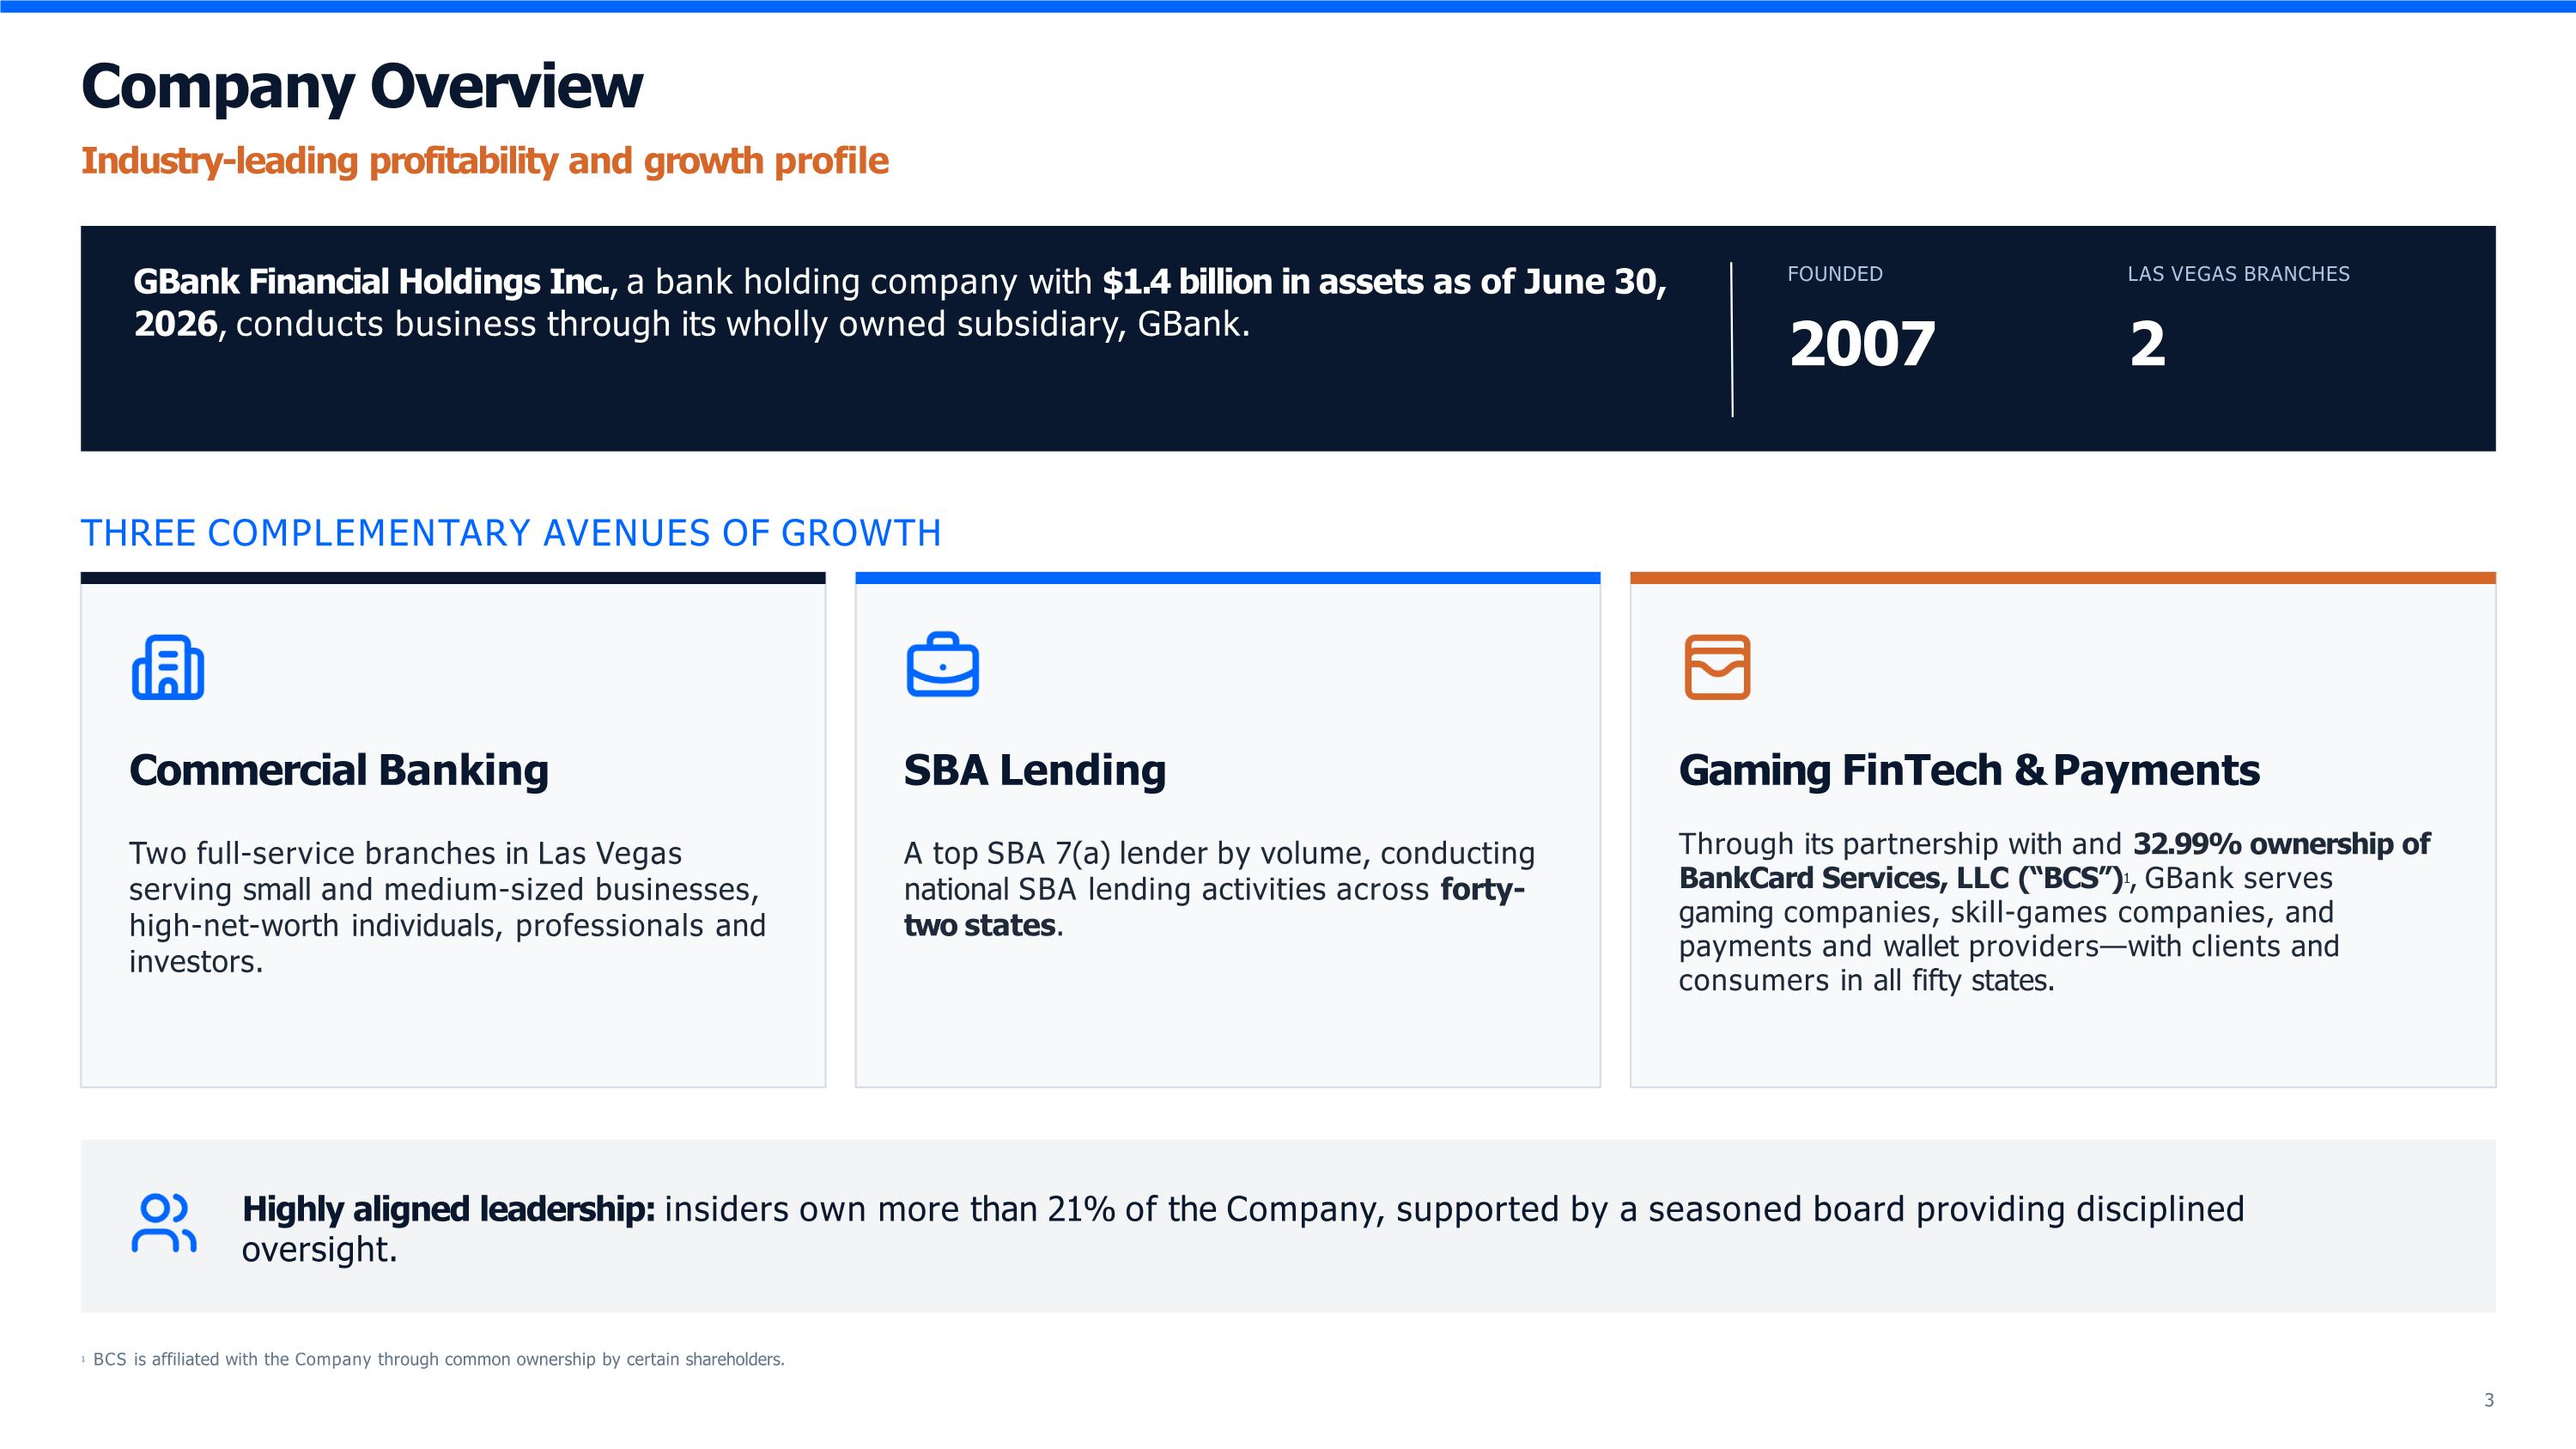
Company Overview Industry-leading profitability and growth profile GBank Financial Holdings Inc., a bank holding company with $1.4 billion in assets as of June 30, 2026, conducts business through its wholly owned subsidiary, GBank. FOUNDED 2007 LAS VEGAS BRANCHES 2 THREE COMPLEMENTARY AVENUES OF GROWTH Commercial Banking Two full-service branches in Las Vegas serving small and medium-sized businesses, high-net-worth individuals, professionals and investors. SBA Lending A top SBA 7(a) lender by volume, conducting national SBA lending activities across forty-two states. Gaming FinTech & Payments Through its partnership with and 32.99% ownership of BankCard Services, LLC (“BCS”)1, GBank serves gaming companies, skill-games companies, and payments and wallet providers—with clients and consumers in all fifty states. Highly aligned leadership: insiders own more than 21% of the Company, supported by a seasoned board providing disciplined oversight. 3 1 BCS is affiliated with the Company through common ownership by certain shareholders.
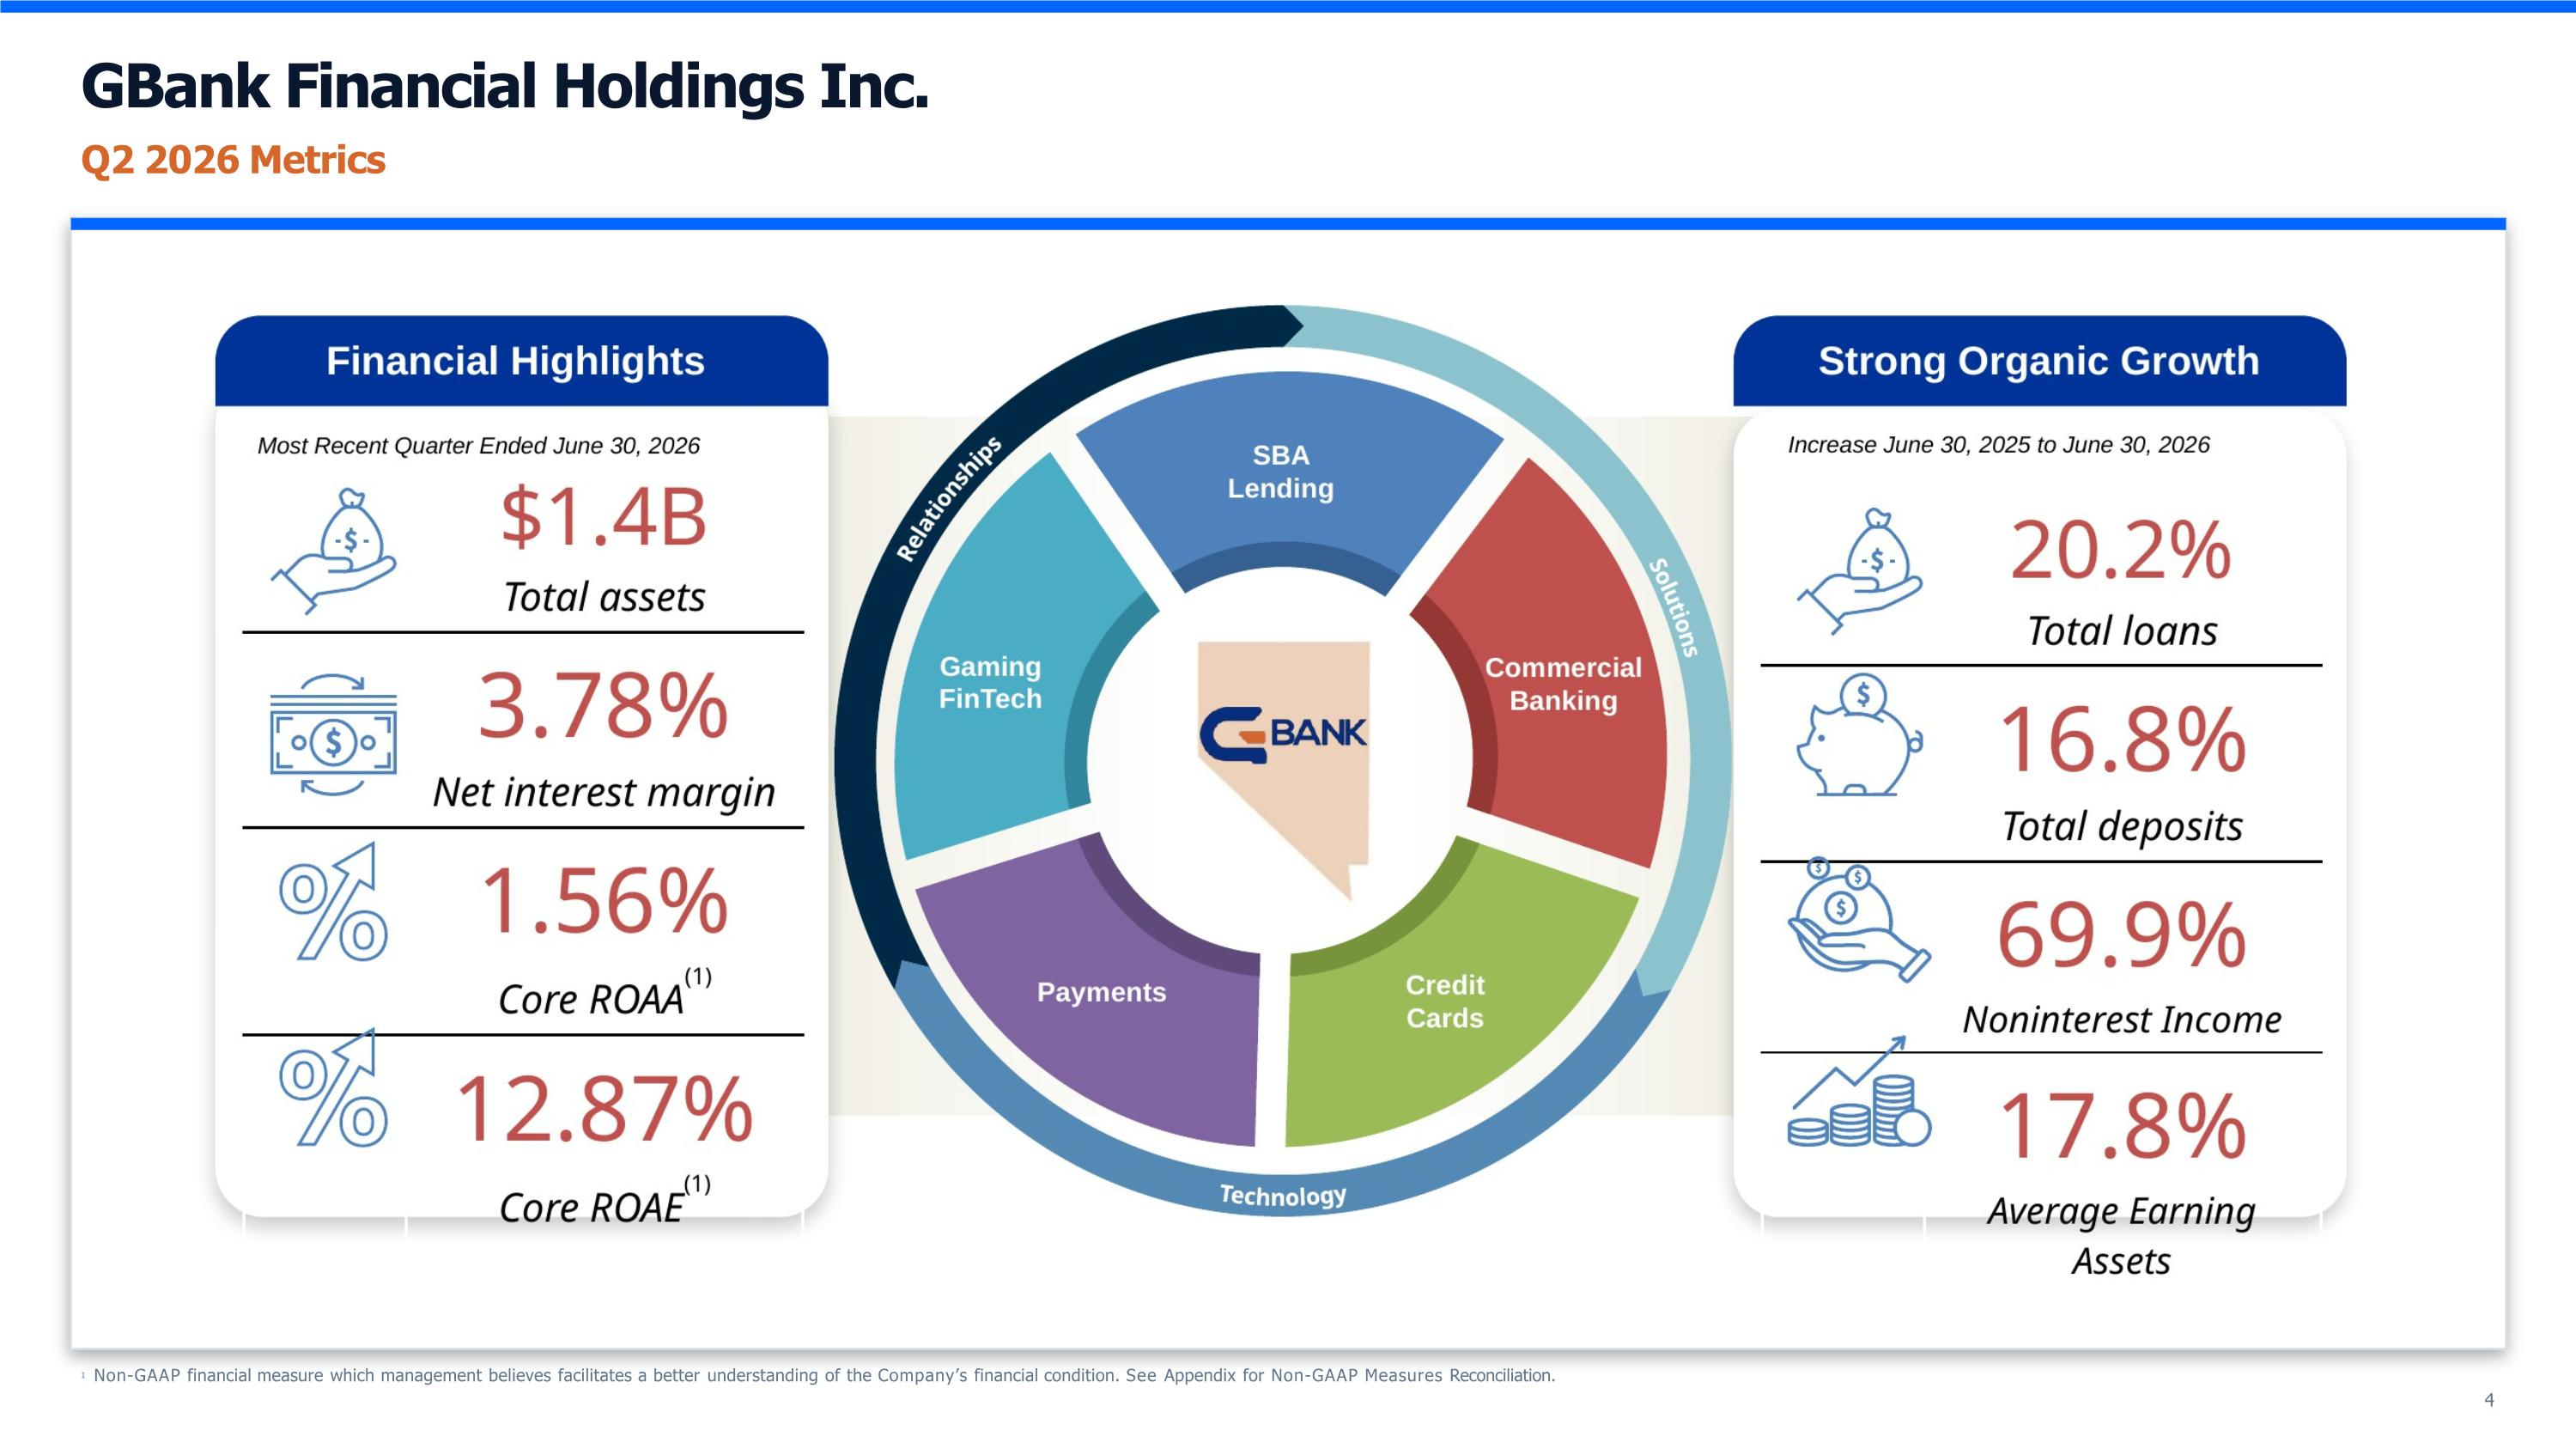
GBank Financial Holdings Inc. Q2 2026 Metrics 1 Non-GAAP financial measure which management believes facilitates a better understanding of the Company’s financial condition. See Appendix for Non-GAAP Measures Reconciliation. 4
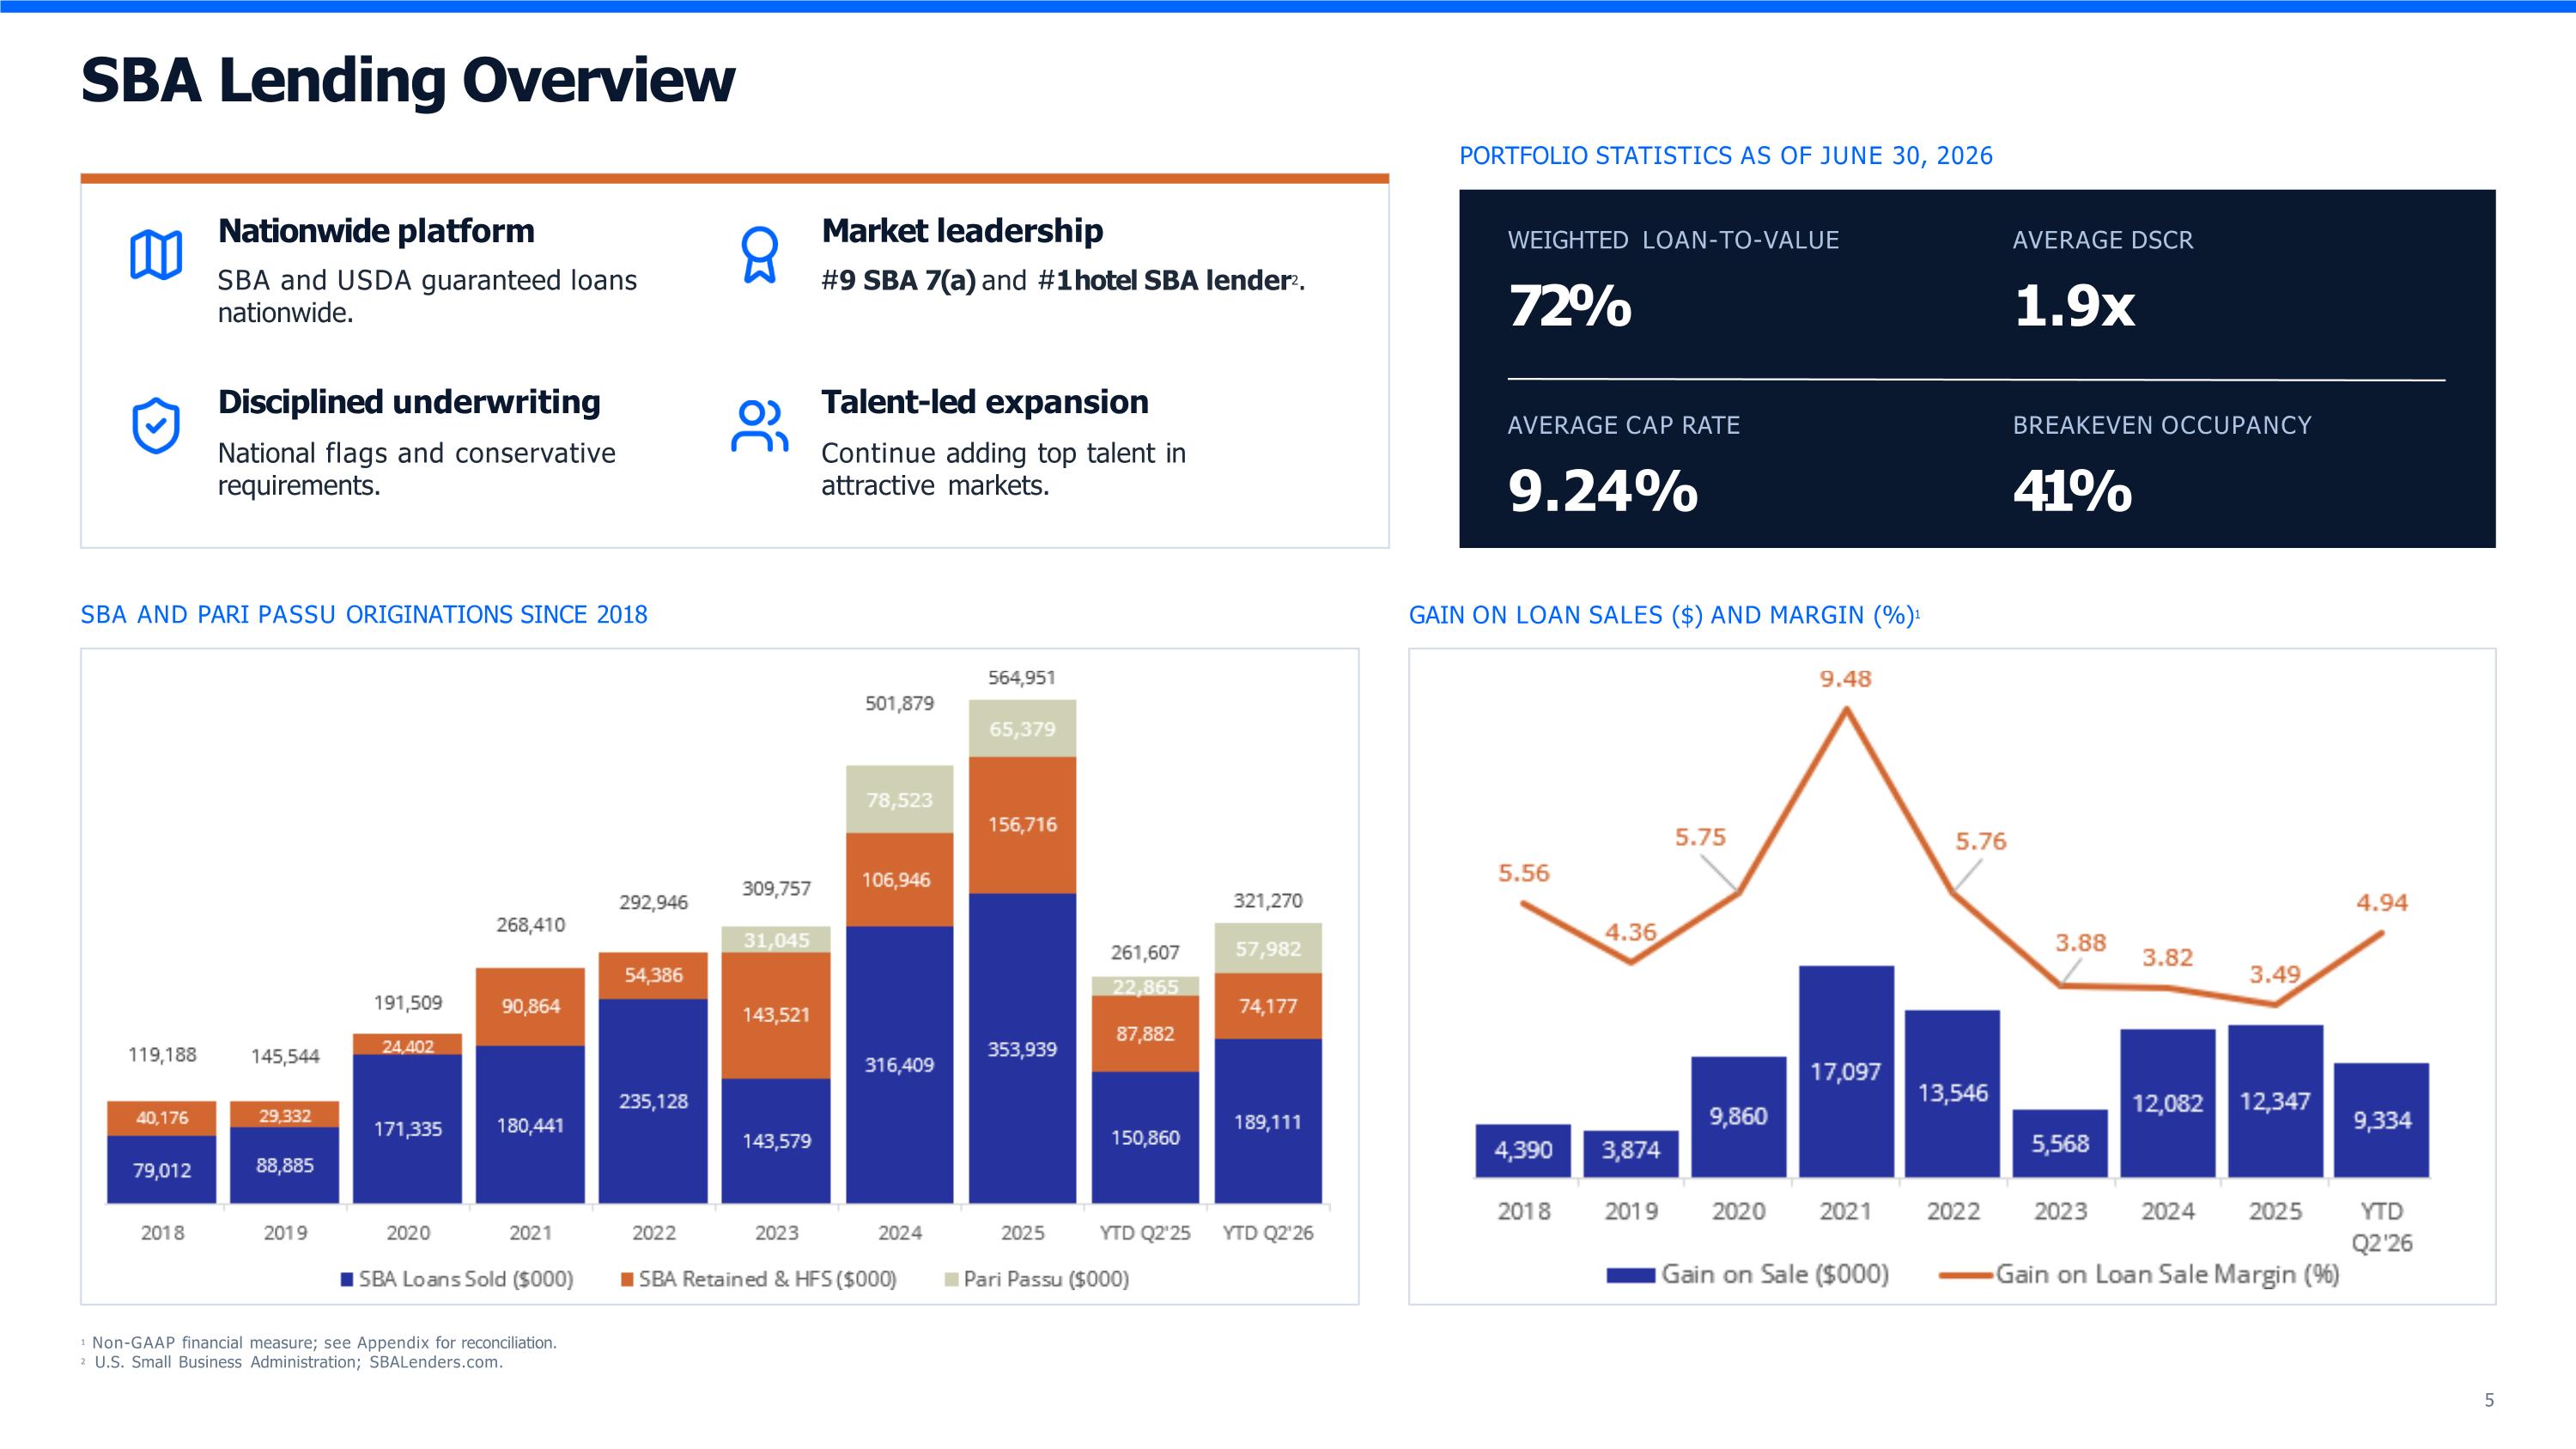
SBA Lending Overview Nationwide platform SBA and USDA guaranteed loans nationwide. Market leadership 9 SBA 7(a) and 1 hotel SBA lender2. Disciplined underwriting National flags and conservative requirements. Talent-led expansion Continue adding top talent in attractive markets. PORTFOLIO STATISTICS AS OF JUNE 30, 2026 WEIGHTED LOAN-TO-VALUE 72% AVERAGE DSCR 1.9x AVERAGE CAP RATE 9.24% BREAKEVEN OCCUPANCY 41% SBA AND PARI PASSU ORIGINATIONS SINCE 2018 GAIN ON LOAN SALES ($) AND MARGIN (%)1 1 Non-GAAP financial measure; see Appendix for reconciliation. 2 U.S. Small Business Administration; SBALenders.com. 5
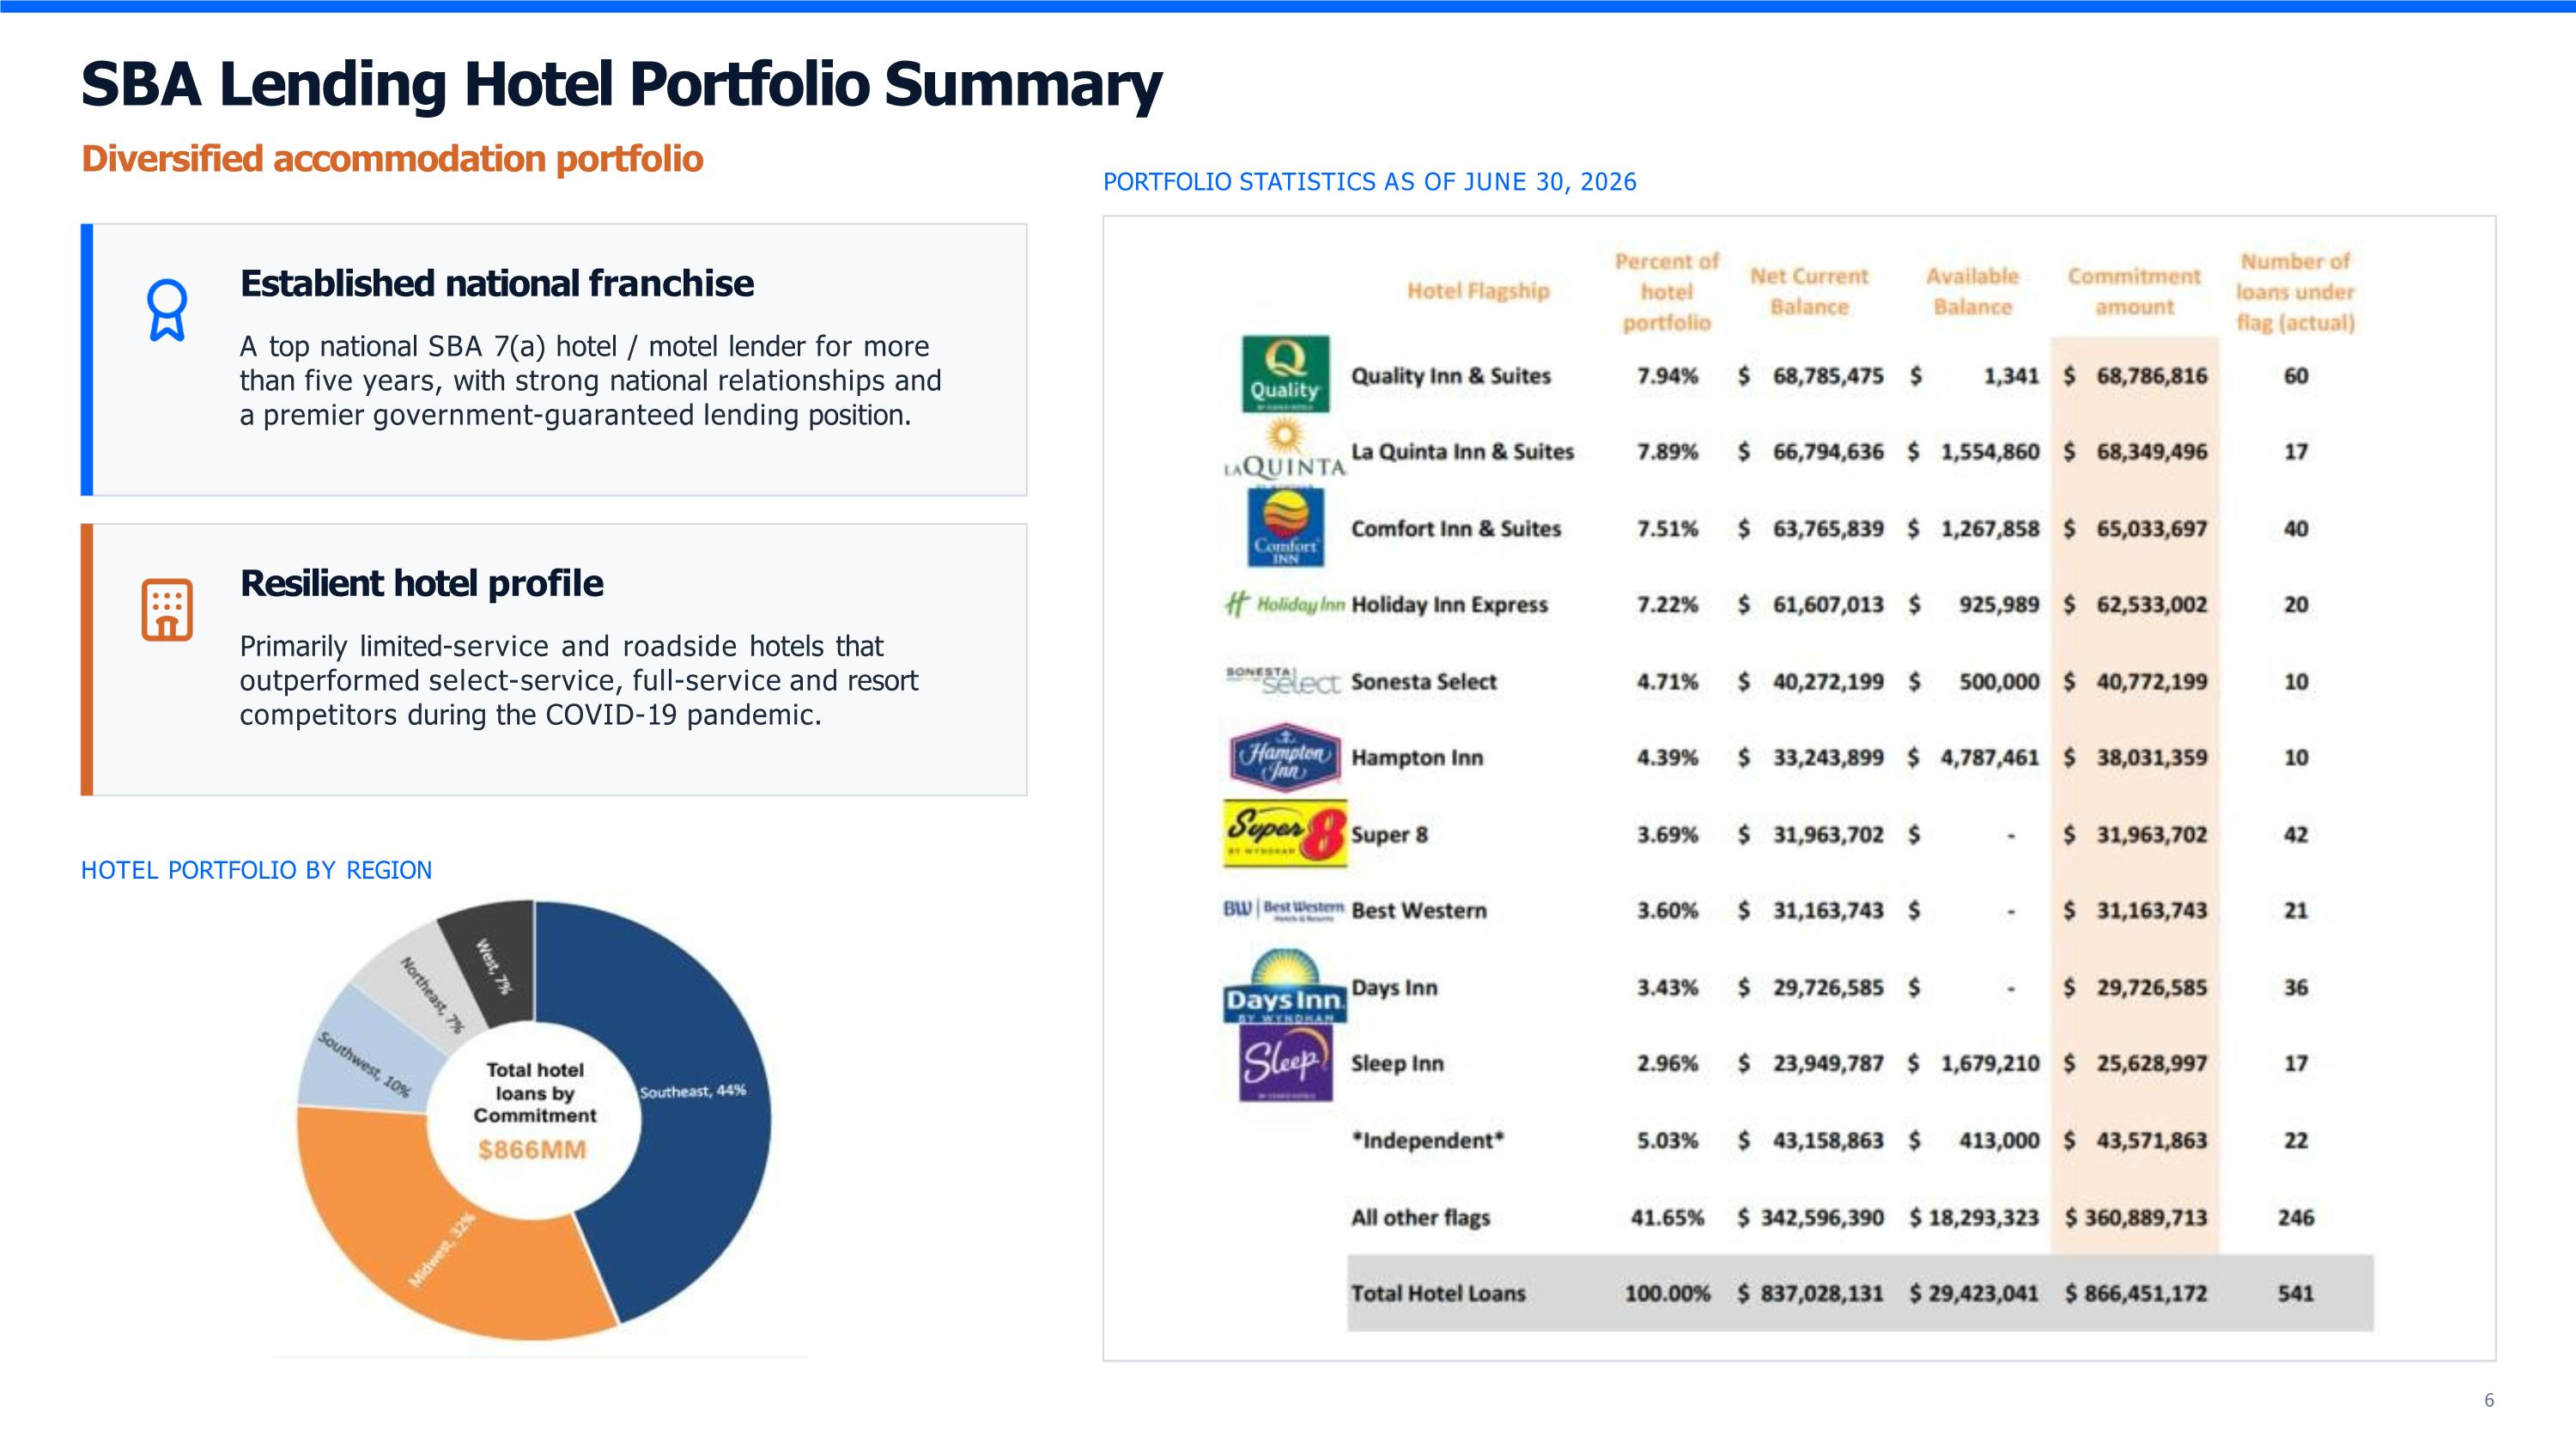
SBA Lending Hotel Portfolio Summary Diversified accommodation portfolio Established national franchise A top national SBA 7(a) hotel / motel lender for more than five years, with strong national relationships and a premier government-guaranteed lending position. Resilient hotel profile Primarily limited-service and roadside hotels that outperformed select-service, full-service and resort competitors during the COVID-19 pandemic. HOTEL PORTFOLIO BY REGION PORTFOLIO STATISTICS AS OF JUNE 30, 2026 6
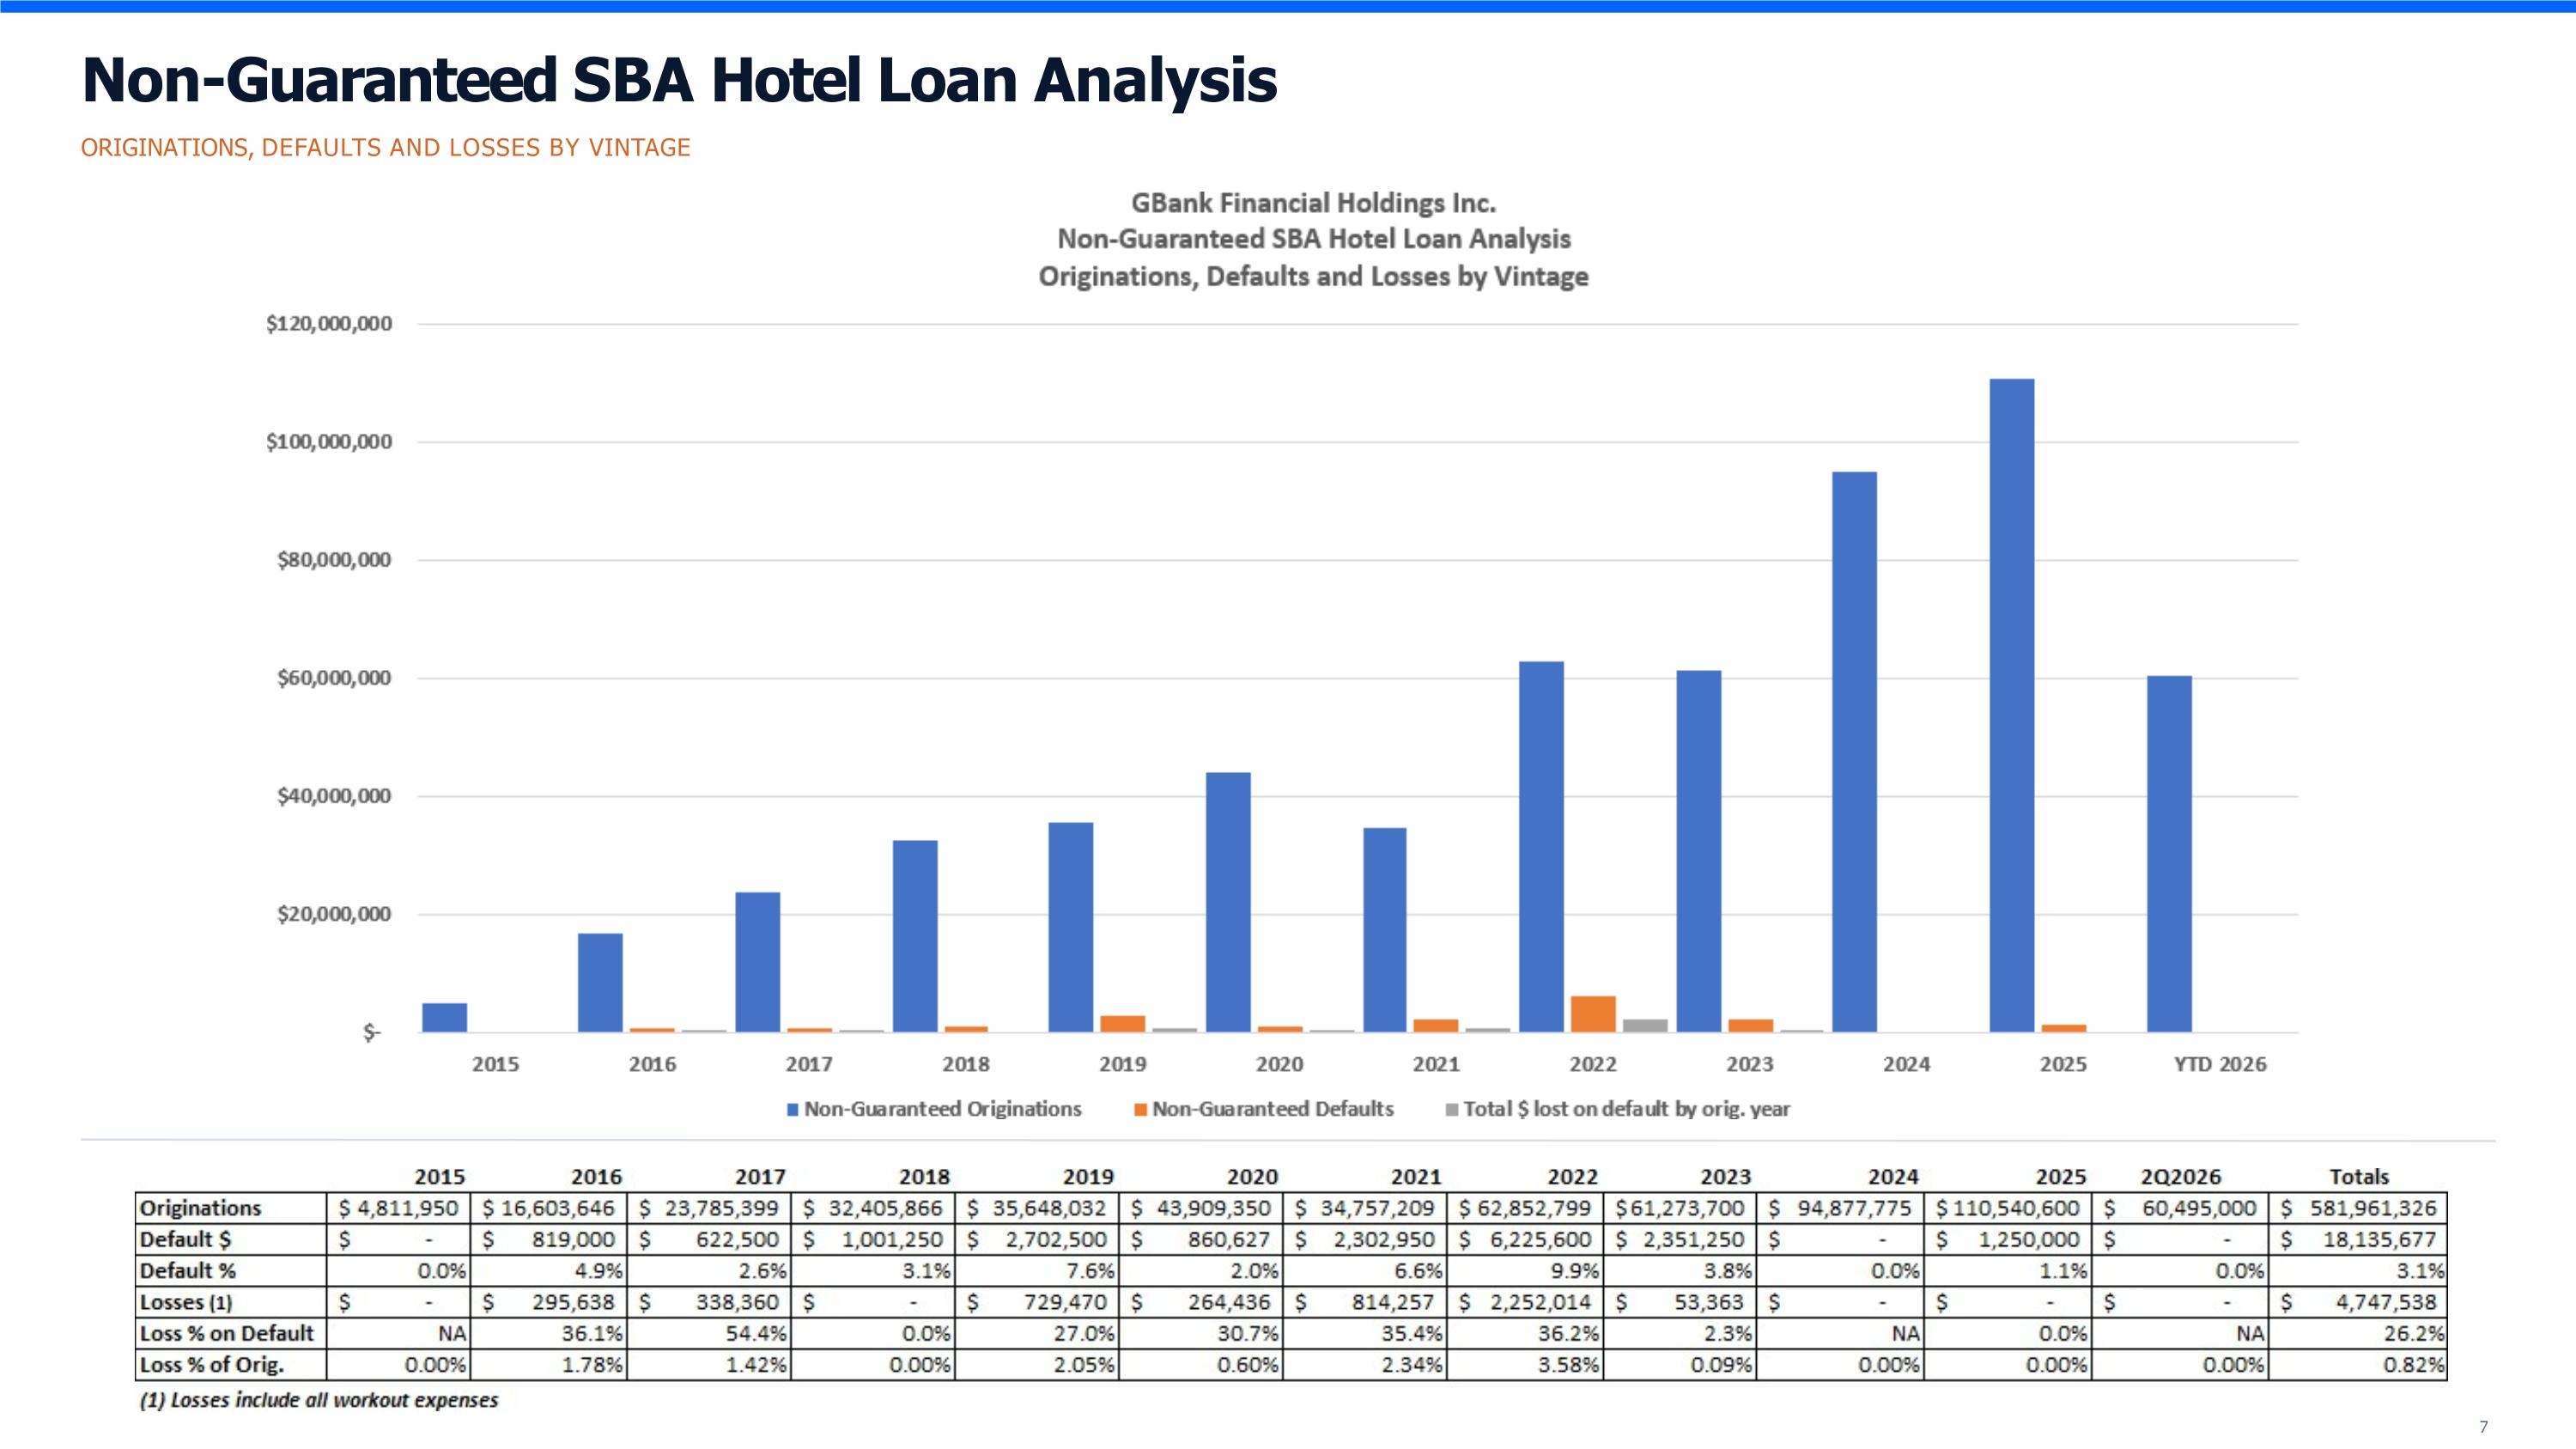
Non-Guaranteed SBA Hotel Loan Analysis ORIGINATIONS, DEFAULTS AND LOSSES BY VINTAGE
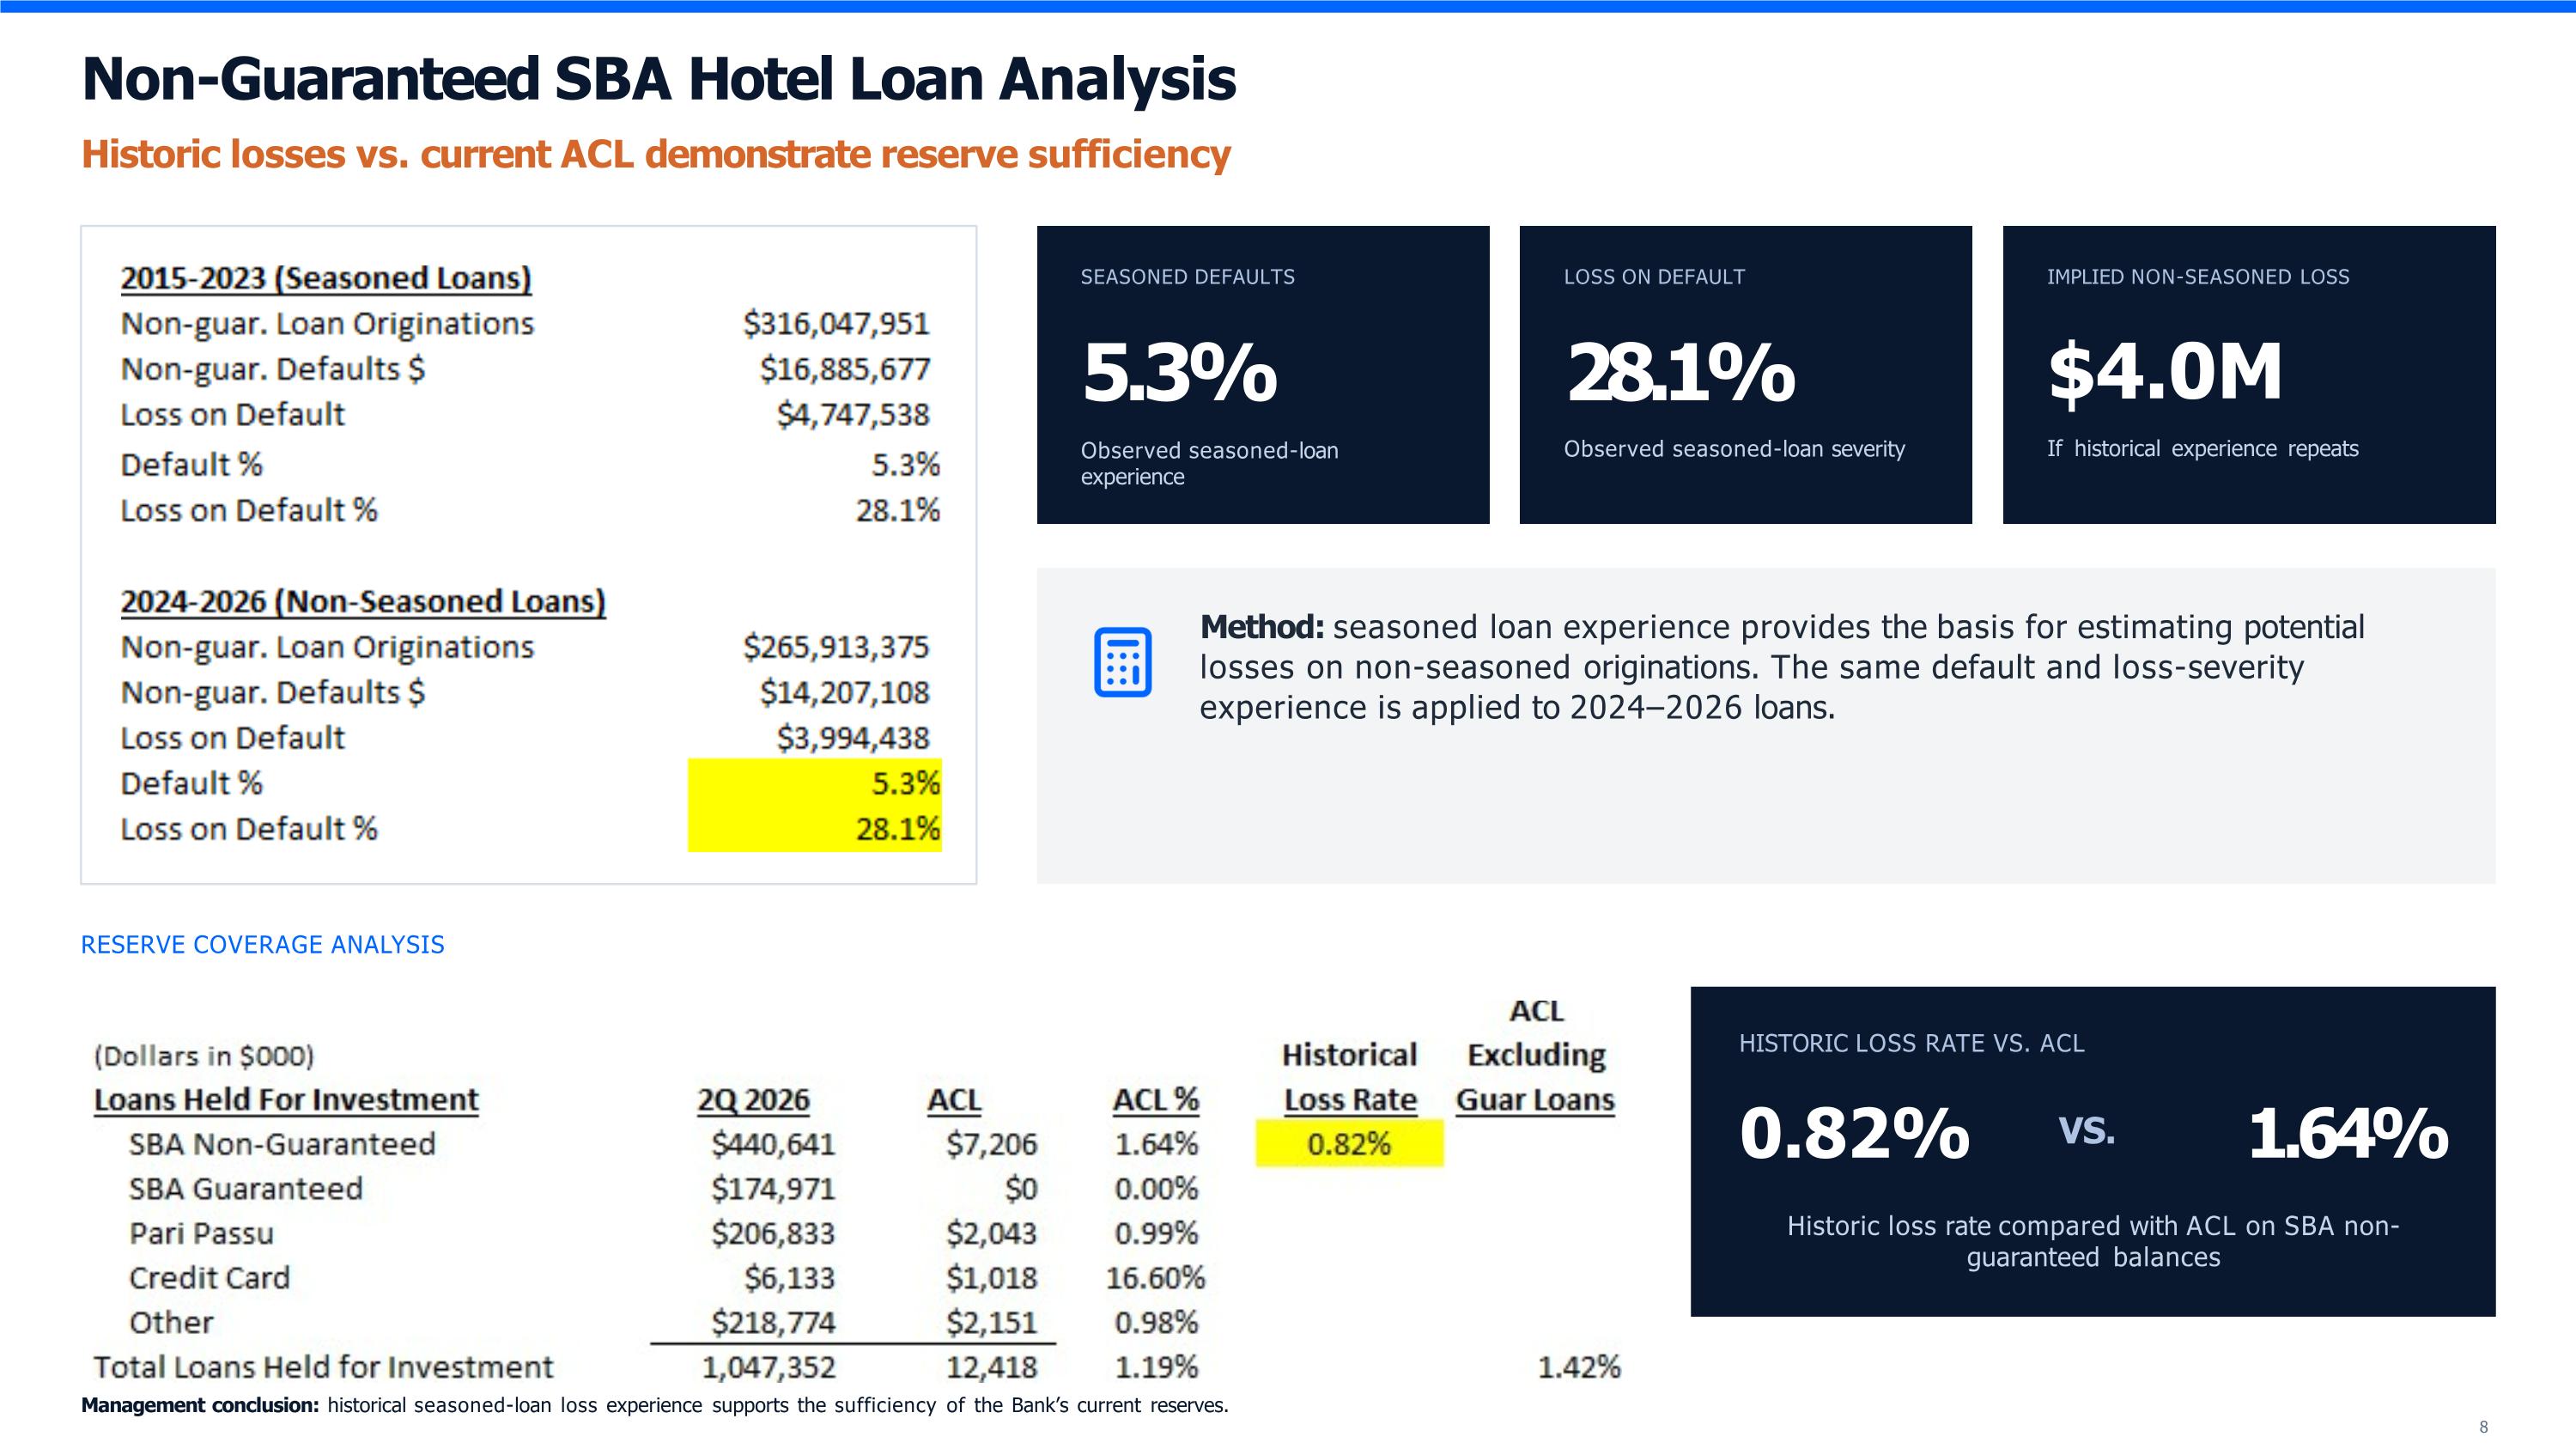
Non-Guaranteed SBA Hotel Loan Analysis Historic losses vs. current ACL demonstrate reserve sufficiency SEASONED DEFAULTS 5.3% Observed seasoned-loan experience LOSS ON DEFAULT 28.1% Observed seasoned-loan severity IMPLIED NON-SEASONED LOSS $4.0M If historical experience repeats Method: seasoned loan experience provides the basis for estimating potential losses on non-seasoned originations. The same default and loss-severity experience is applied to 2024–2026 loans. RESERVE COVERAGE ANALYSIS HISTORIC LOSS RATE VS. ACL VS. 0.82% 1.64% Historic loss rate compared with ACL on SBA non- guaranteed balances Management conclusion: historical seasoned-loan loss experience supports the sufficiency of the Bank’s current reserves.
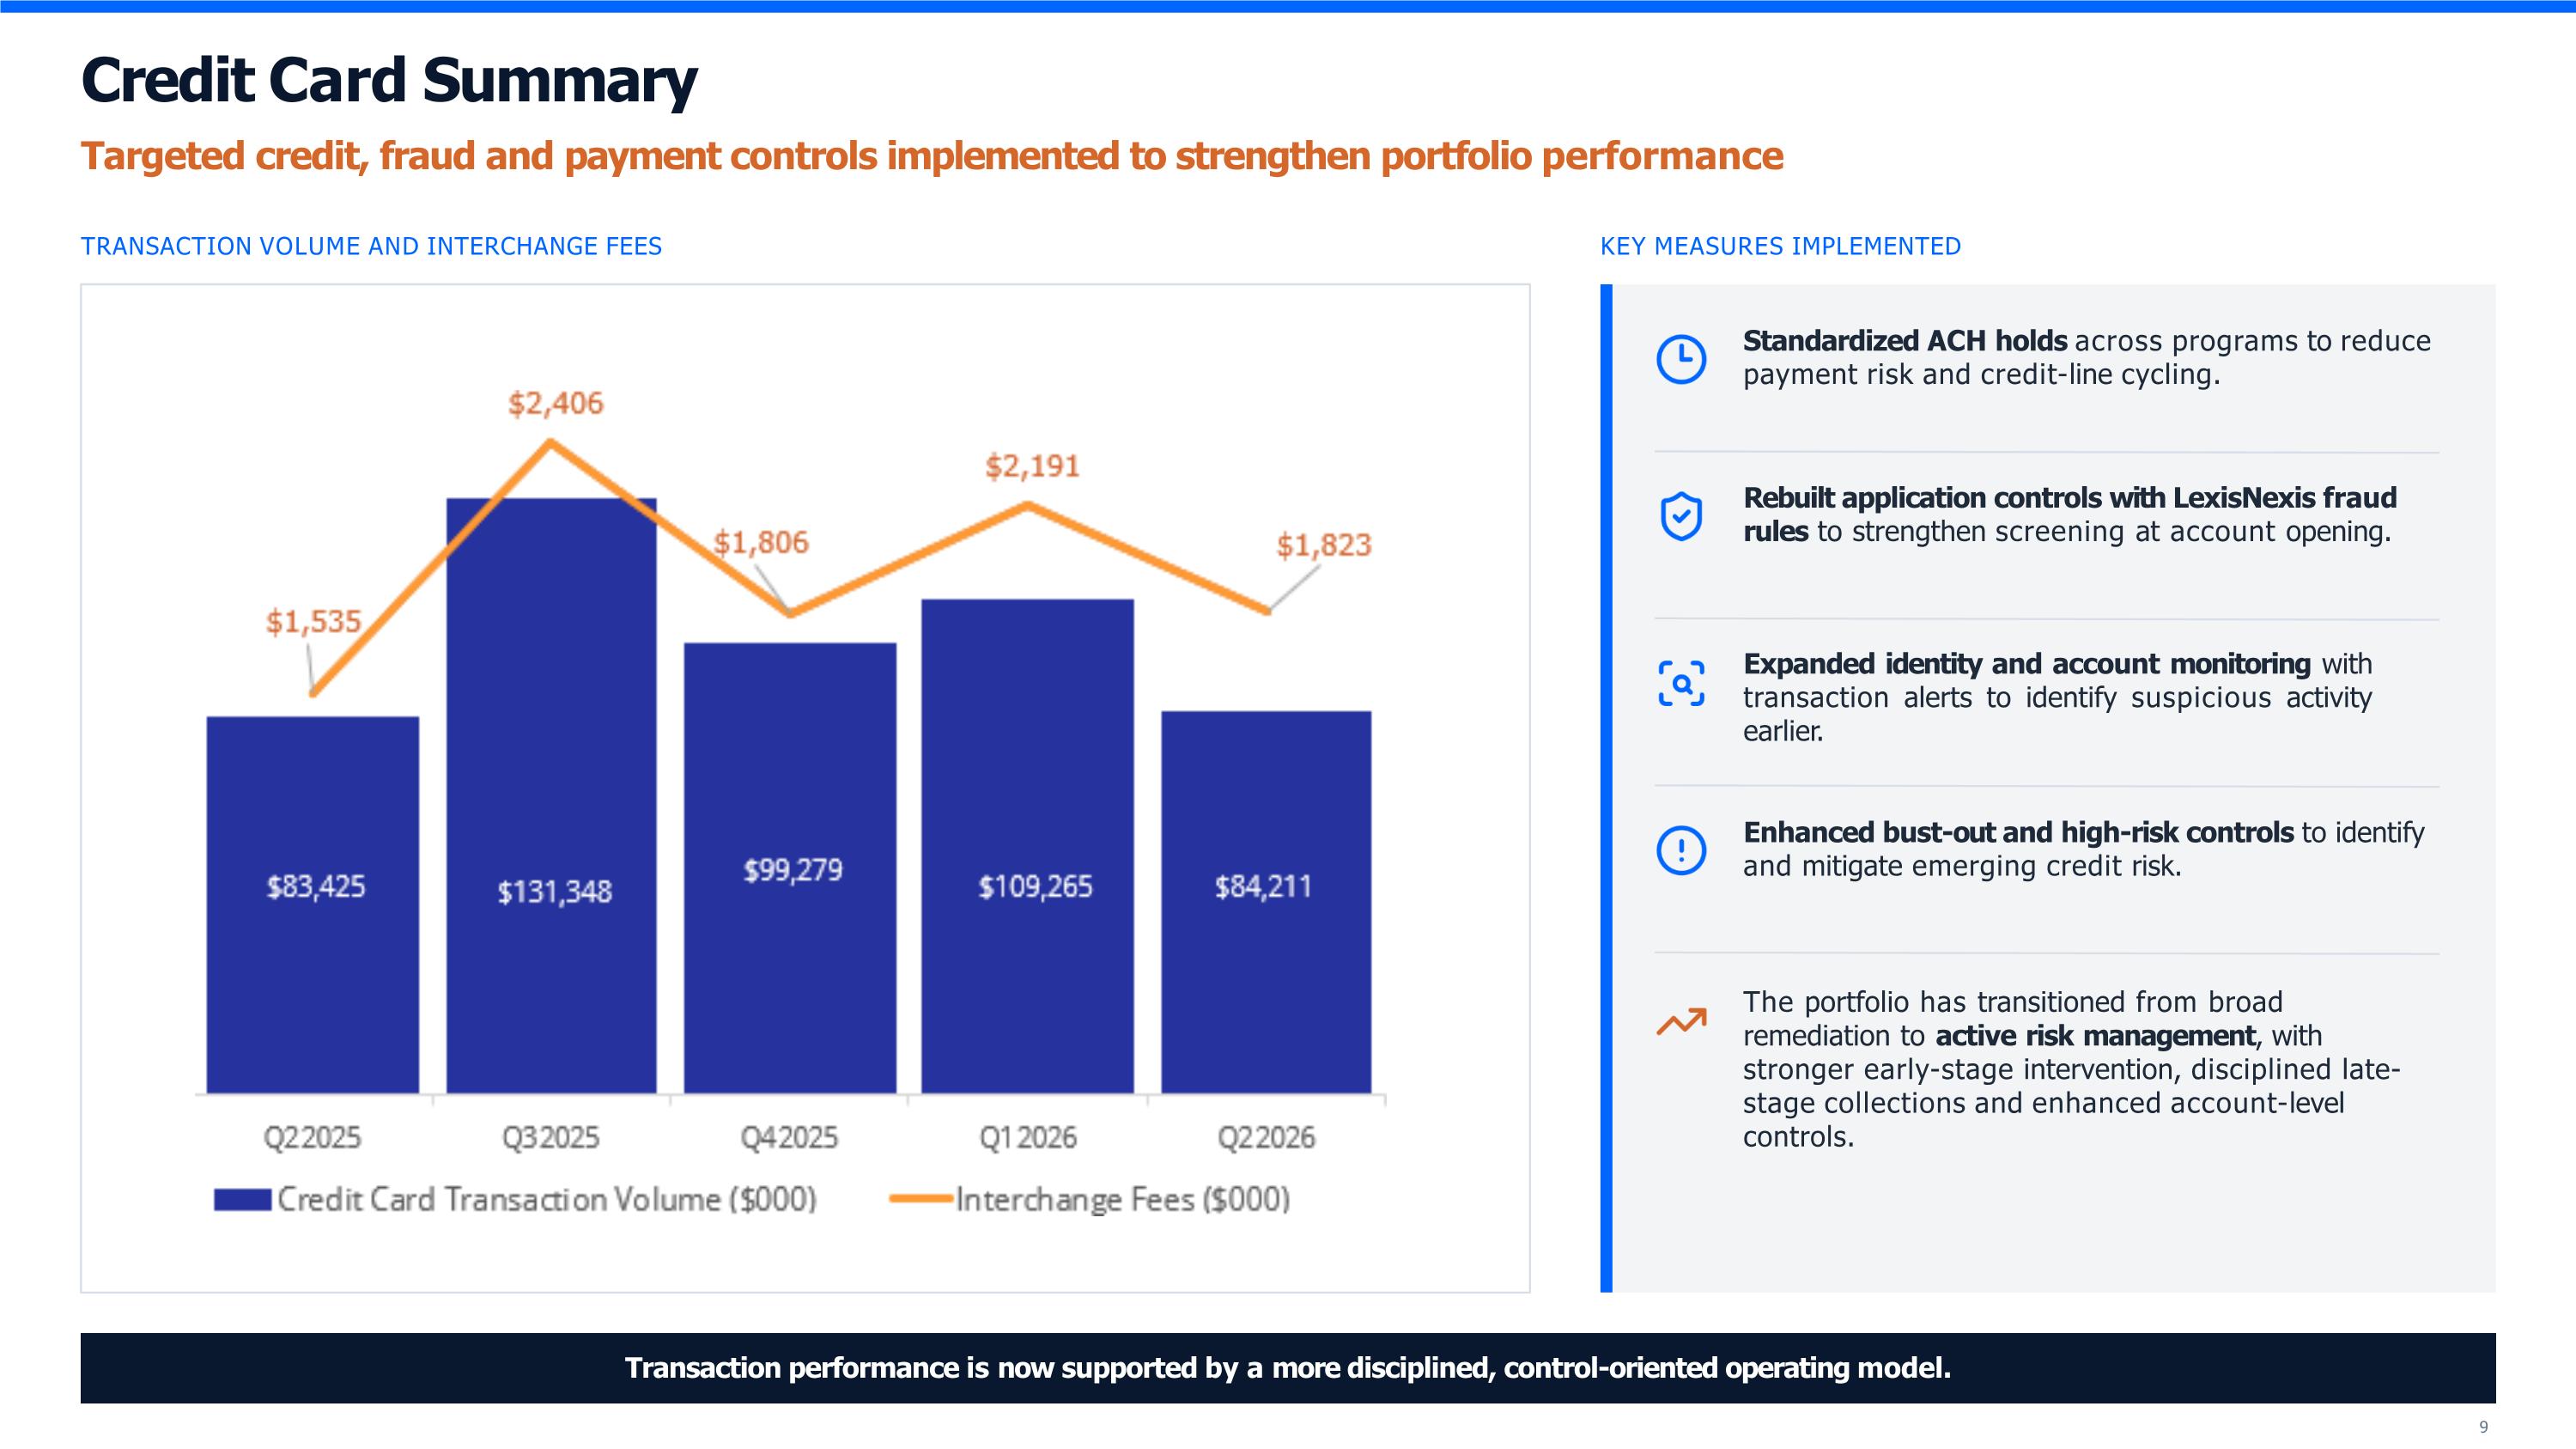
Credit Card Summary Targeted credit, fraud and payment controls implemented to strengthen portfolio performance TRANSACTION VOLUME AND INTERCHANGE FEES KEY MEASURES IMPLEMENTED Standardized ACH holds across programs to reduce payment risk and credit-line cycling. Rebuilt application controls with LexisNexis fraud rules to strengthen screening at account opening. Expanded identity and account monitoring with transaction alerts to identify suspicious activity earlier. Enhanced bust-out and high-risk controls to identify and mitigate emerging credit risk. The portfolio has transitioned from broad remediation to active risk management, with stronger early-stage intervention, disciplined late-stage collections and enhanced account-level controls. Transaction performance is now supported by a more disciplined, control-oriented operating model.
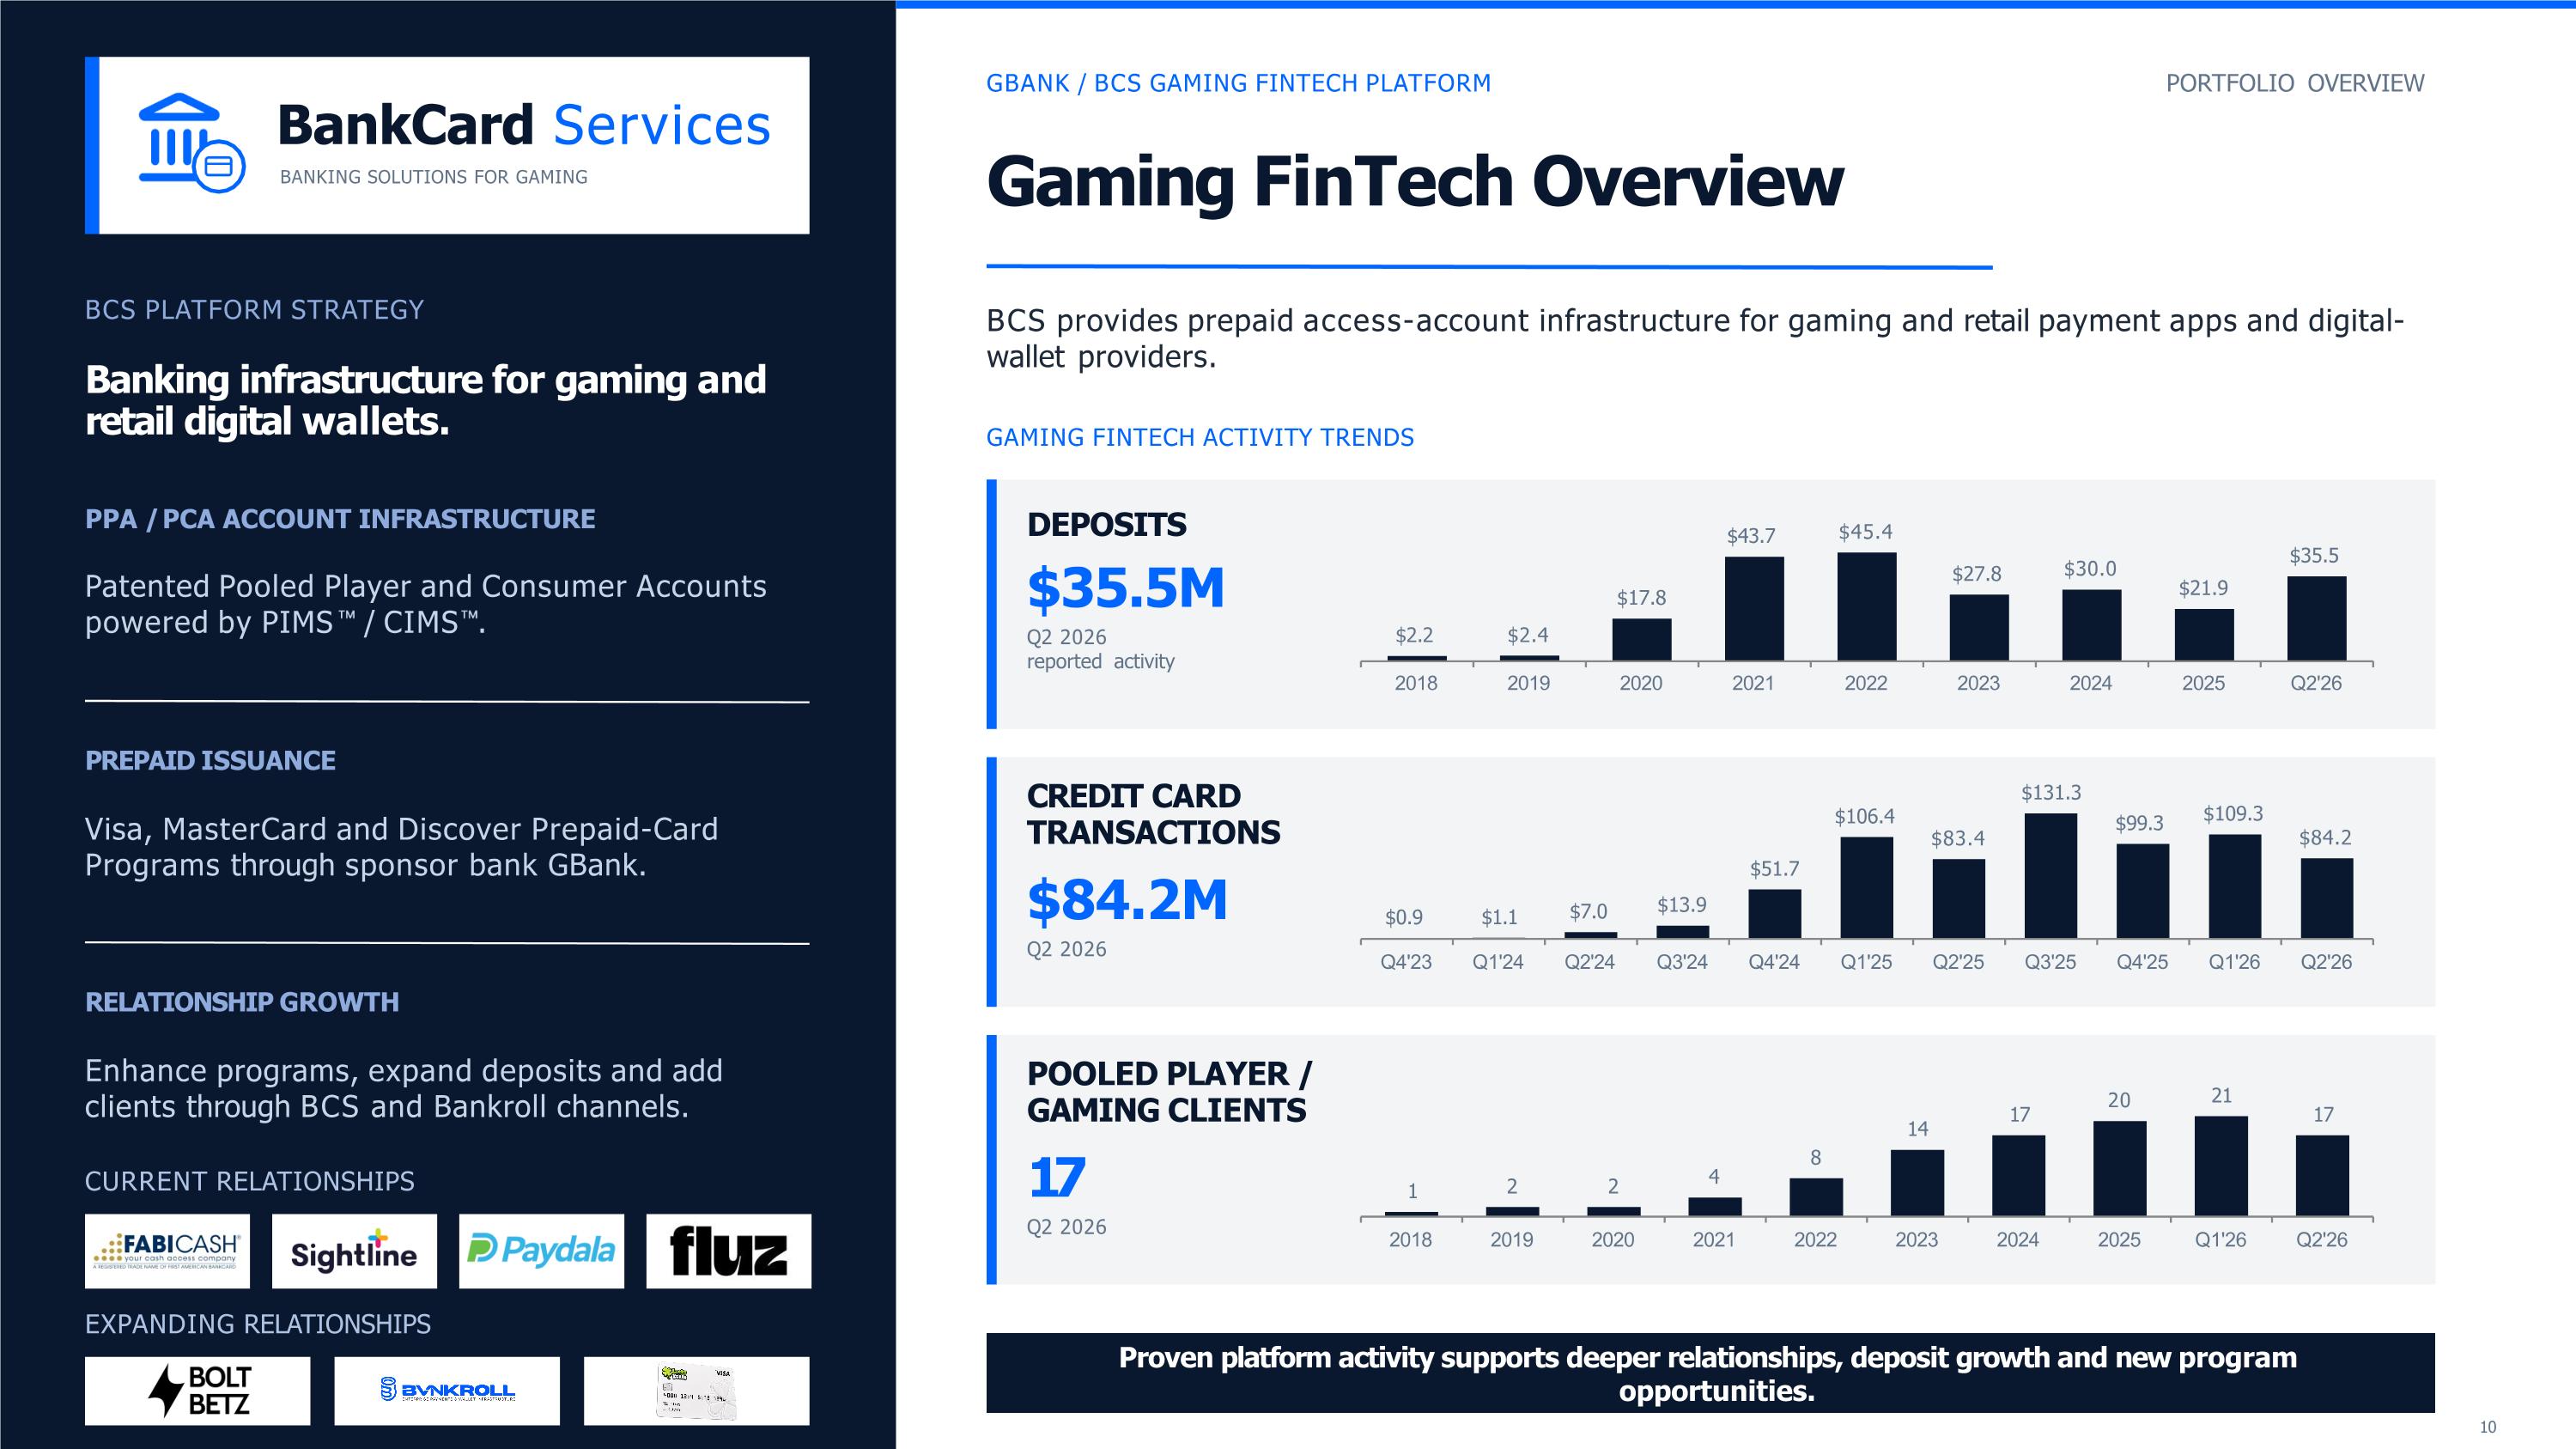
BankCard Services BANKING SOLUTIONS FOR GAMING BCS PLATFORM STRATEGY Banking infrastructure for gaming and retail digital wallets. PPA / PCA ACCOUNT INFRASTRUCTURE Patented Pooled Player and Consumer Accounts powered by PIMS / CIMS . PREPAID ISSUANCE Visa, MasterCard and Discover Prepaid-Card Programs through sponsor bank GBank. RELATIONSHIP GROWTH Enhance programs, expand deposits and add clients through BCS and Bankroll channels. CURRENT RELATIONSHIPS EXPANDING RELATIONSHIPS GBANK / BCS GAMING FINTECH PLATFORM PORTFOLIO OVERVIEW Gaming FinTech Overview BCS provides prepaid access-account infrastructure for gaming and retail payment apps and digital- wallet providers. GAMING FINTECH ACTIVITY TRENDS DEPOSITS $35.5M Q2 2026 reported activity $17.8 $43.7 $45.4 $27.8 $30.0 $21.9 $35.5 $2.2 $2.4 2018 2019 2020 2021 2022 2023 2024 2025 Q2'26 CREDIT CARD TRANSACTIONS $84.2M Q2 2026 $0.9 $1.1 $7.0 $13.9 $51.7 $106.4 $83.4 $131.3 $99.3 $109.3 $84.2 Q4'23 Q1'24 Q2'24 Q3'24 Q4'24 Q1'25 Q2'25 Q3'25 Q4'25 Q1'26 Q2'26 POOLED PLAYER / GAMING CLIENTS 17 Q2 2026 1 2 2 4 8 14 17 20 21 17 2018 2019 2020 2021 2022 2023 2024 2025 Q1'26 Q2'26 Proven platform activity supports deeper relationships, deposit growth and new program opportunities.
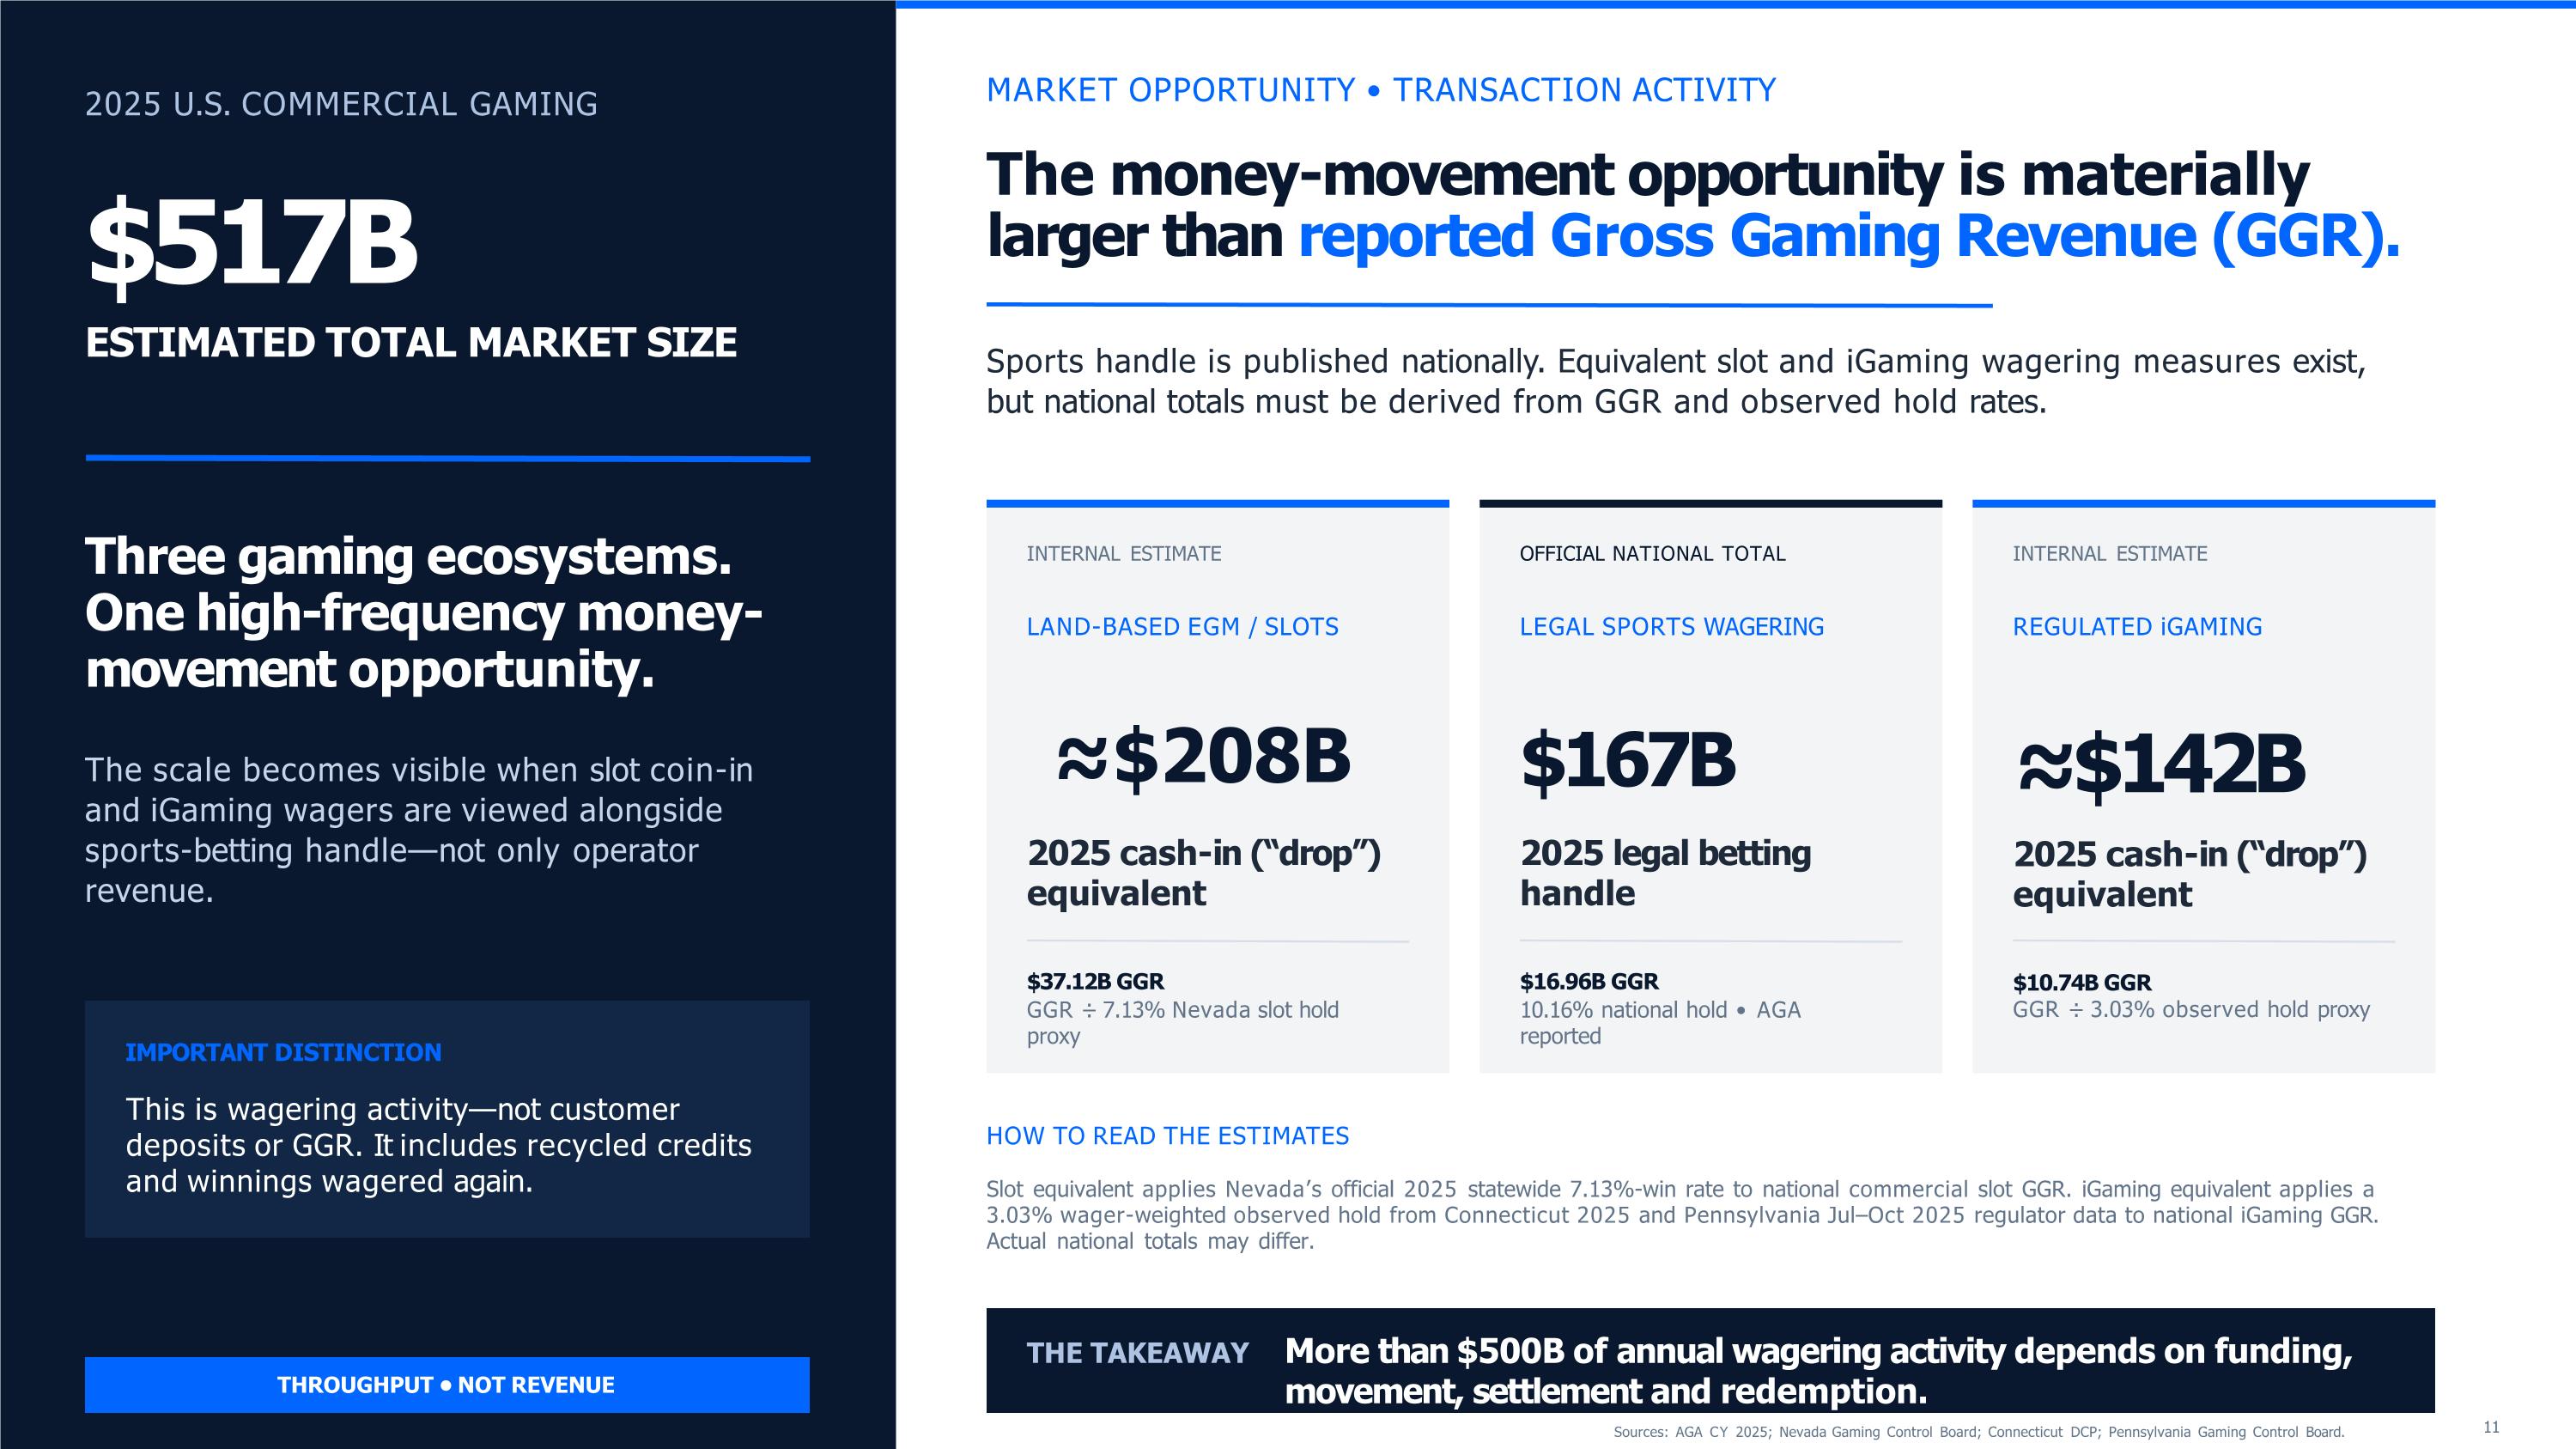
2025 U.S. COMMERCIAL GAMING $517B ESTIMATED TOTAL MARKET SIZE Three gaming ecosystems. One high-frequency money-movement opportunity. The scale becomes visible when slot coin-in and iGaming wagers are viewed alongside sports-betting handle—not only operator revenue. IMPORTANT DISTINCTION This is wagering activity—not customer deposits or GGR. It includes recycled credits and winnings wagered again. THROUGHPUT • NOT REVENUE MARKET OPPORTUNITY • TRANSACTION ACTIVITY The money-movement opportunity is materially larger than reported Gross Gaming Revenue (GGR). Sports handle is published nationally. Equivalent slot and iGaming wagering measures exist, but national totals must be derived from GGR and observed hold rates. INTERNAL ESTIMATE LAND-BASED EGM / SLOTS ≈$208B 2025 cash-in (“drop”) equivalent $37.12B GGR GGR ÷ 7.13% Nevada slot hold proxy OFFICIAL NATIONAL TOTAL LEGAL SPORTS WAGERING $167B 2025 legal betting handle $16.96B GGR 10.16% national hold • AGA reported INTERNAL ESTIMATE REGULATED iGAMING ≈$142B 2025 cash-in (“drop”) equivalent $10.74B GGR GGR ÷ 3.03% observed hold proxy Sources: AGA CY 2025; Nevada Gaming Control Board; Connecticut DCP; Pennsylvania Gaming Control Board. HOW TO READ THE ESTIMATES Slot equivalent applies Nevada’s official 2025 statewide 7.13%-win rate to national commercial slot GGR. iGaming equivalent applies a 3.03% wager-weighted observed hold from Connecticut 2025 and Pennsylvania Jul–Oct 2025 regulator data to national iGaming GGR. Actual national totals may differ. THE TAKEAWAY More than $500B of annual wagering activity depends on funding, movement, settlement and redemption.
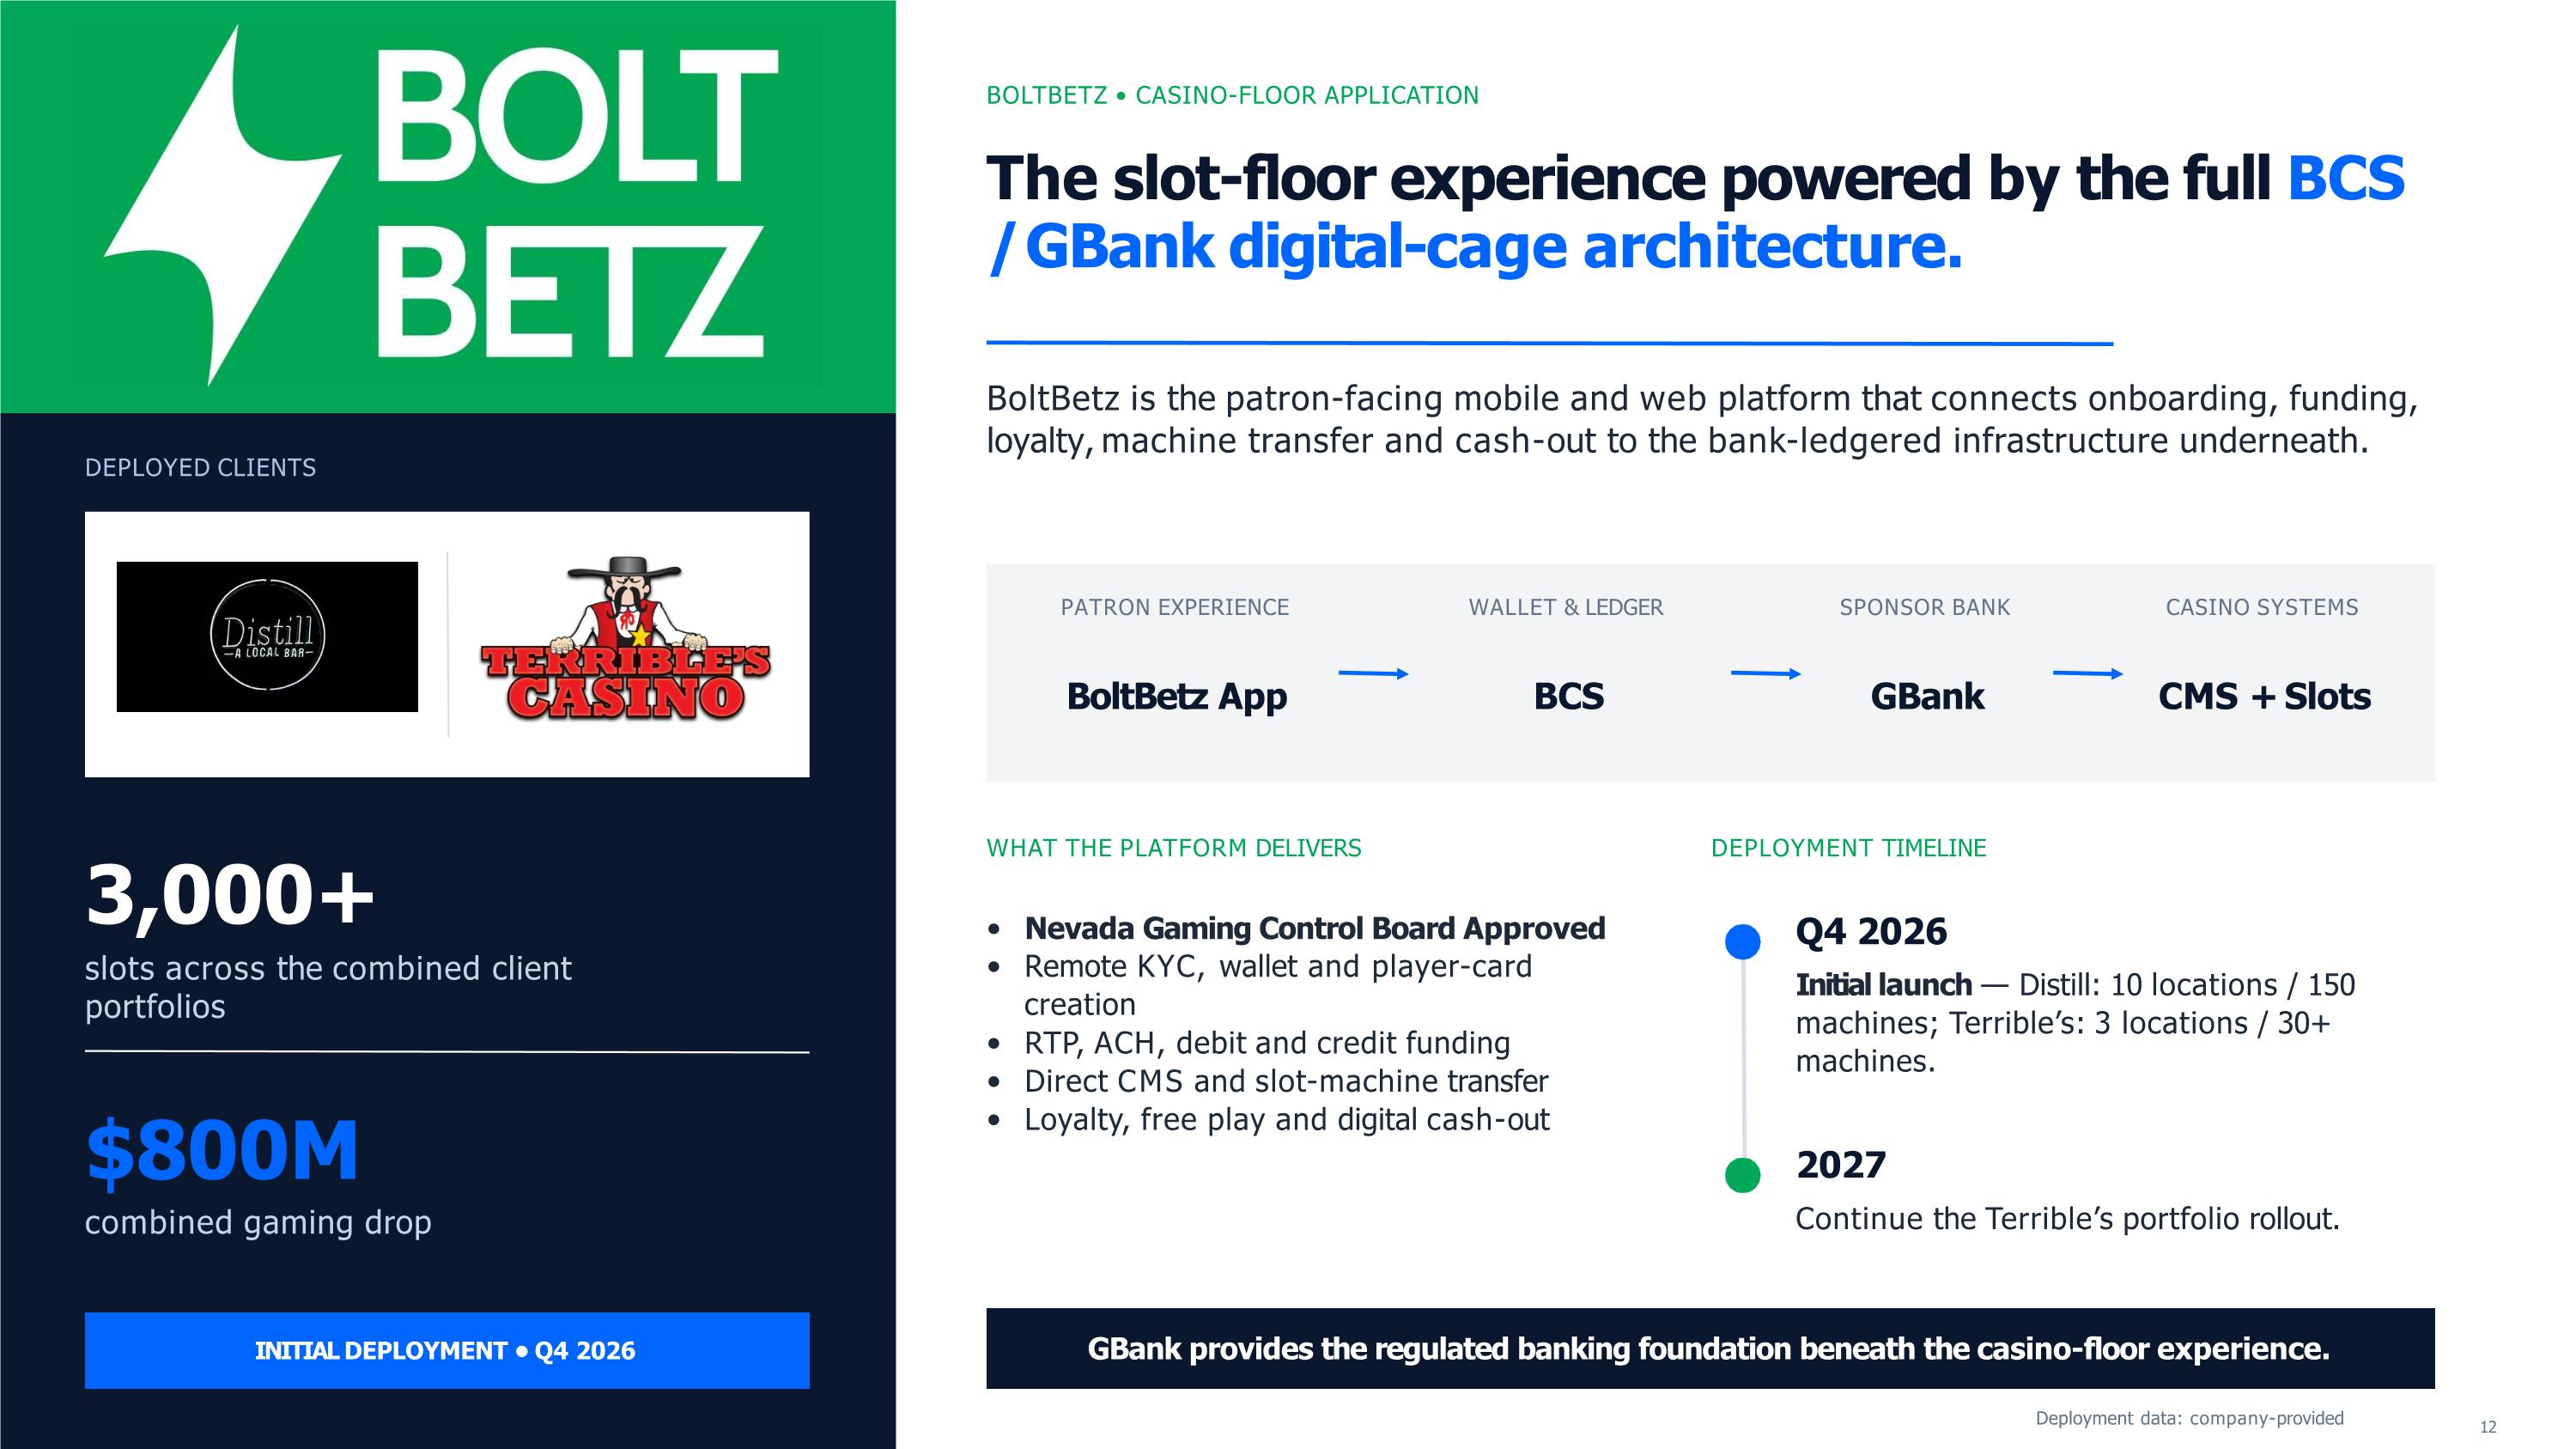
DEPLOYED CLIENTS 3,000+ slots across the combined client portfolios $800M combined gaming drop INITIAL DEPLOYMENT • Q4 2026 BOLTBETZ • CASINO-FLOOR APPLICATION The slot-floor experience powered by the full BCS / GBank digital-cage architecture. BoltBetz is the patron-facing mobile and web platform that connects onboarding, funding, loyalty, machine transfer and cash-out to the bank-ledgered infrastructure underneath. PATRON EXPERIENCE BoltBetz App WALLET & LEDGER BCS SPONSOR BANK GBank CASINO SYSTEMS CMS + Slots WHAT THE PLATFORM DELIVERS Nevada Gaming Control Board Approved Remote KYC, wallet and player-card creation RTP, ACH, debit and credit funding Direct CMS and slot-machine transfer Loyalty, free play and digital cash-out DEPLOYMENT TIMELINE Q4 2026 Initial launch — Distill: 10 locations / 150 machines; Terrible’s: 3 locations / 30+ machines. Deployment data: company-provided 2027 Continue the Terrible’s portfolio rollout. GBank provides the regulated banking foundation beneath the casino-floor experience.
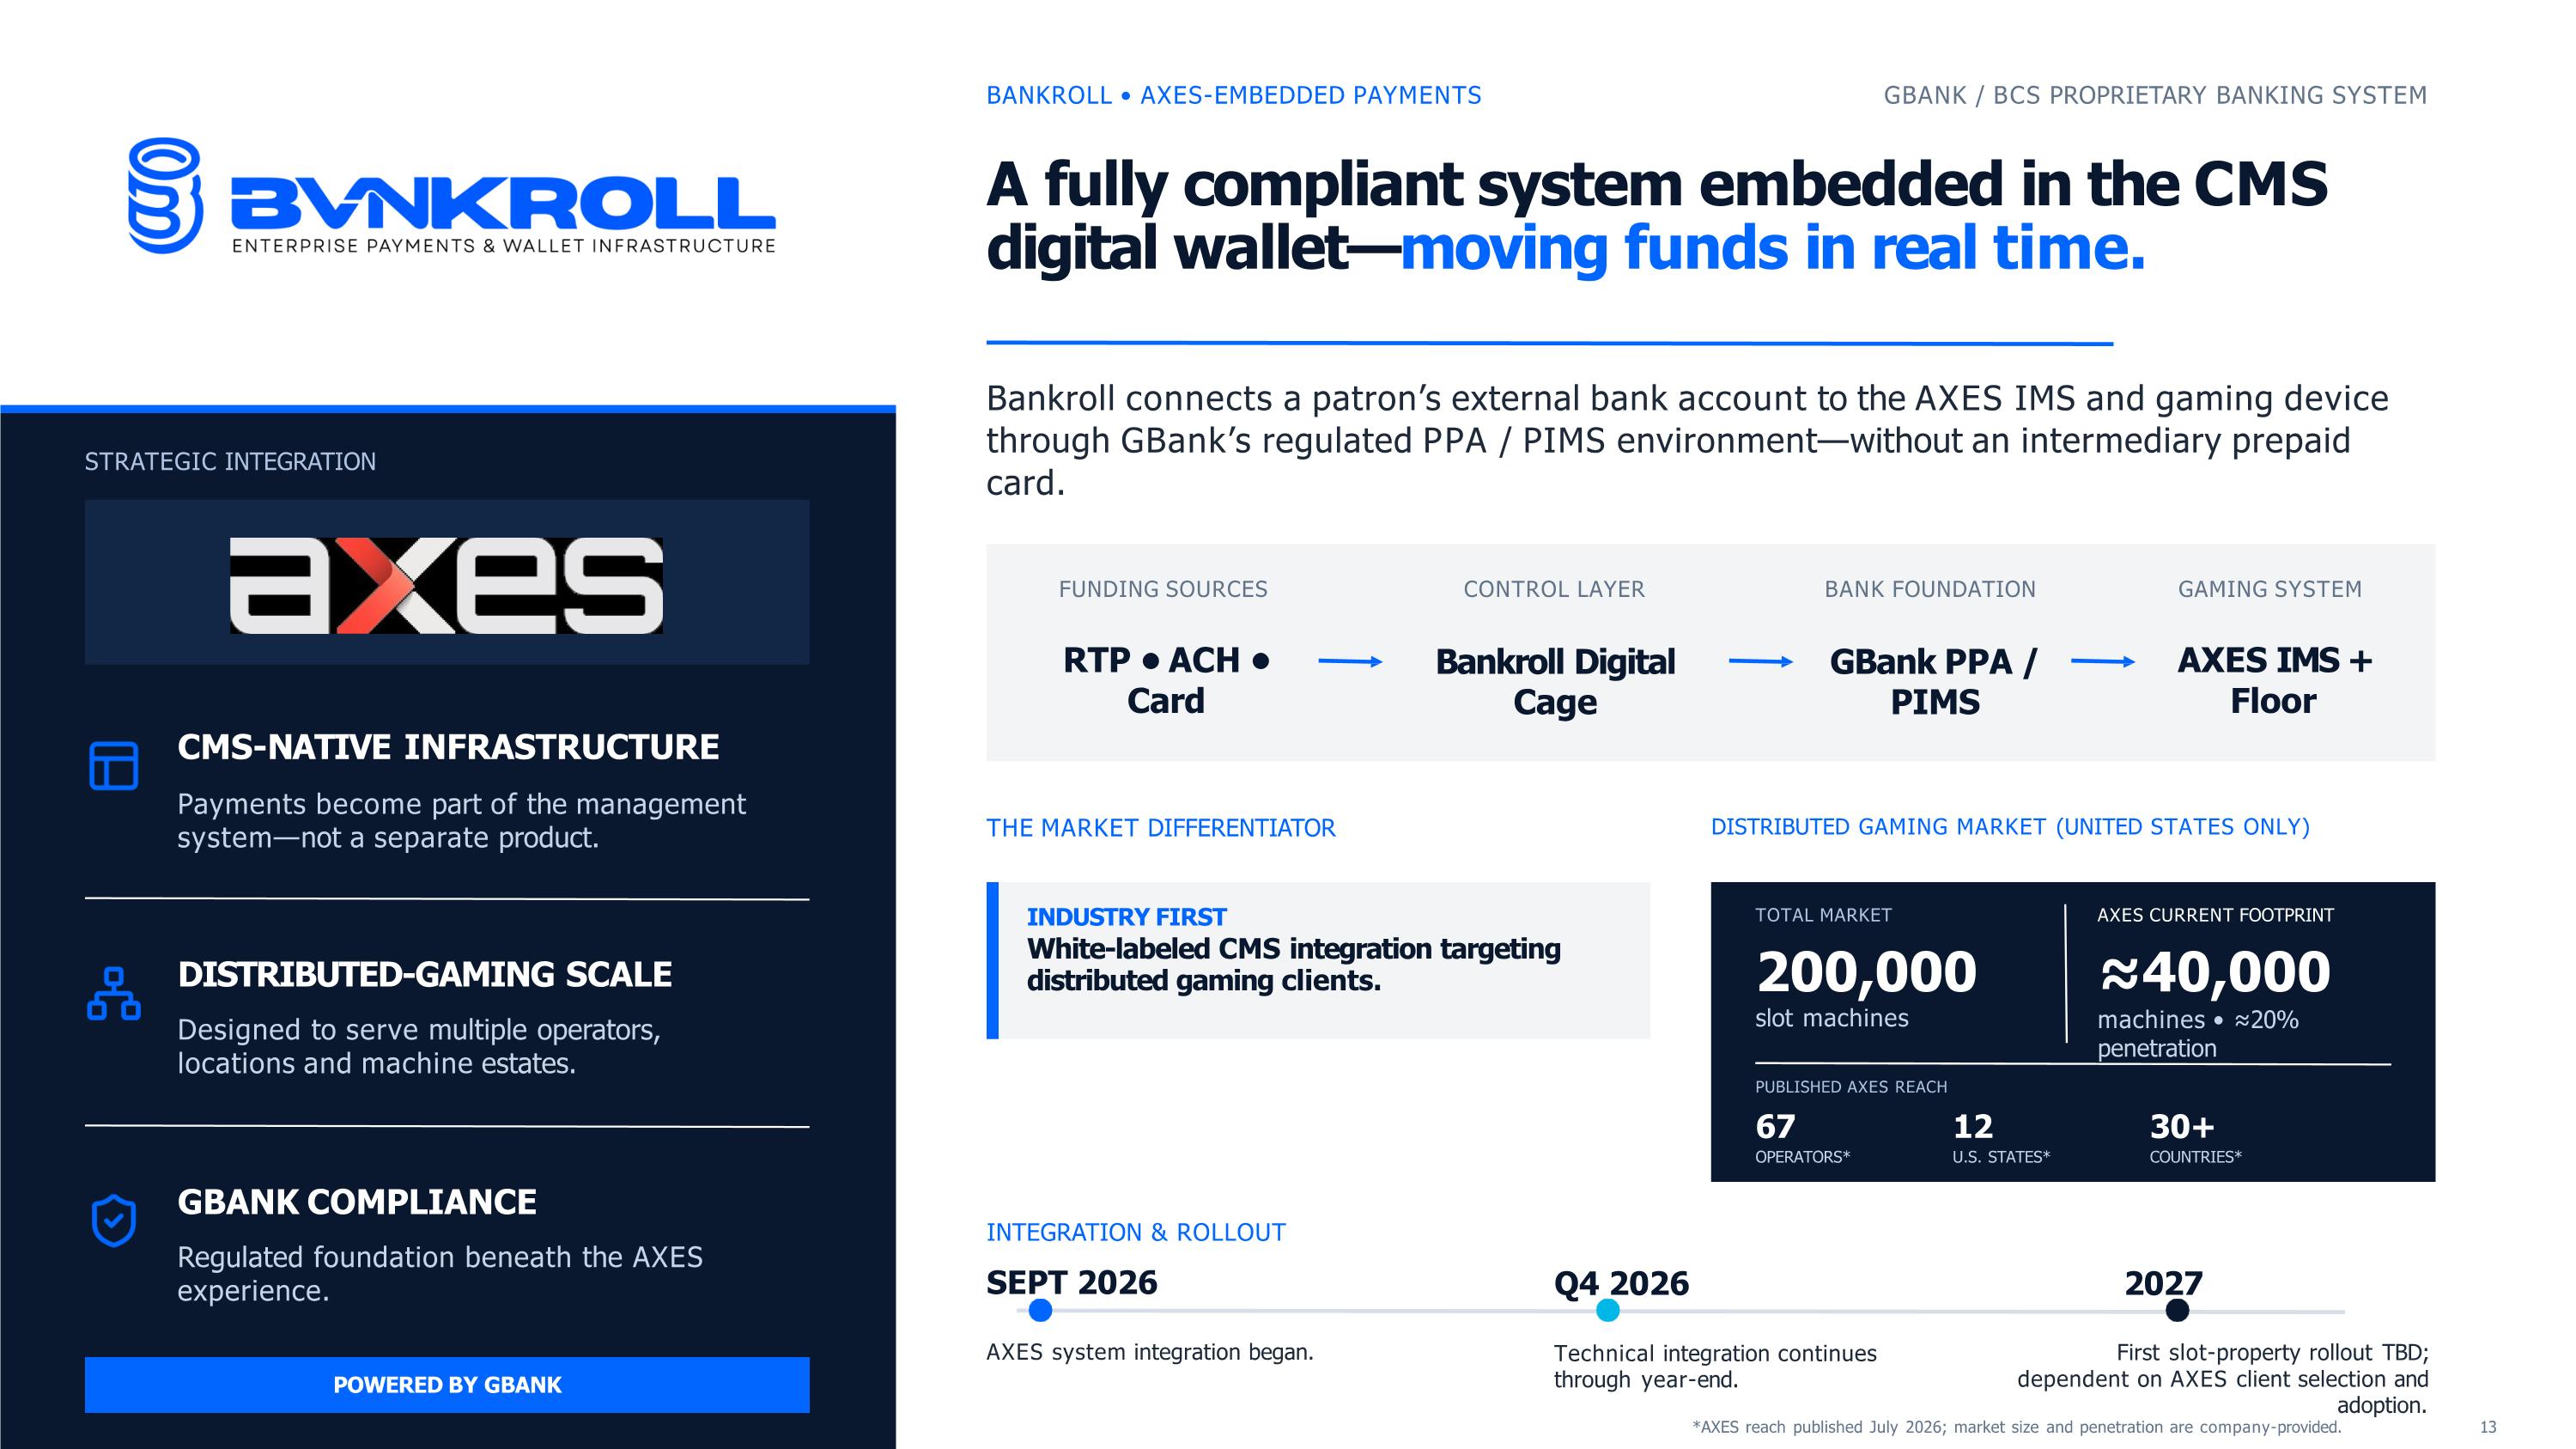
STRATEGIC INTEGRATION CMS-NATIVE INFRASTRUCTURE Payments become part of the management system—not a separate product. DISTRIBUTED-GAMING SCALE Designed to serve multiple operators, locations and machine estates. GBANK COMPLIANCE Regulated foundation beneath the AXES experience. POWERED BY GBANK BANKROLL • AXES-EMBEDDED PAYMENTS GBANK / BCS PROPRIETARY BANKING SYSTEM A fully compliant system embedded in the CMS digital wallet—moving funds in real time. Bankroll connects a patron’s external bank account to the AXES IMS and gaming device through GBank’s regulated PPA / PIMS environment—without an intermediary prepaid card. FUNDING SOURCES RTP • ACH • Card CONTROL LAYER Bankroll Digital Cage BANK FOUNDATION GBank PPA / PIMS GAMING SYSTEM AXES IMS + Floor THE MARKET DIFFERENTIATOR INDUSTRY FIRST White-labeled CMS integration targeting distributed gaming clients. DISTRIBUTED GAMING MARKET (UNITED STATES ONLY) TOTAL MARKET 200,000 slot machines AXES CURRENT FOOTPRINT ≈40,000 machines • ≈20% penetration PUBLISHED AXES REACH 67 12 30+ OPERATORS* U.S. STATES* COUNTRIES* INTEGRATION & ROLLOUT SEPT 2026 AXES system integration began. Q4 2026 Technical integration continues through year-end. 2027 First slot-property rollout TBD; dependent on AXES client selection and adoption. *AXES reach published July 2026; market size and penetration are company-provided. 13
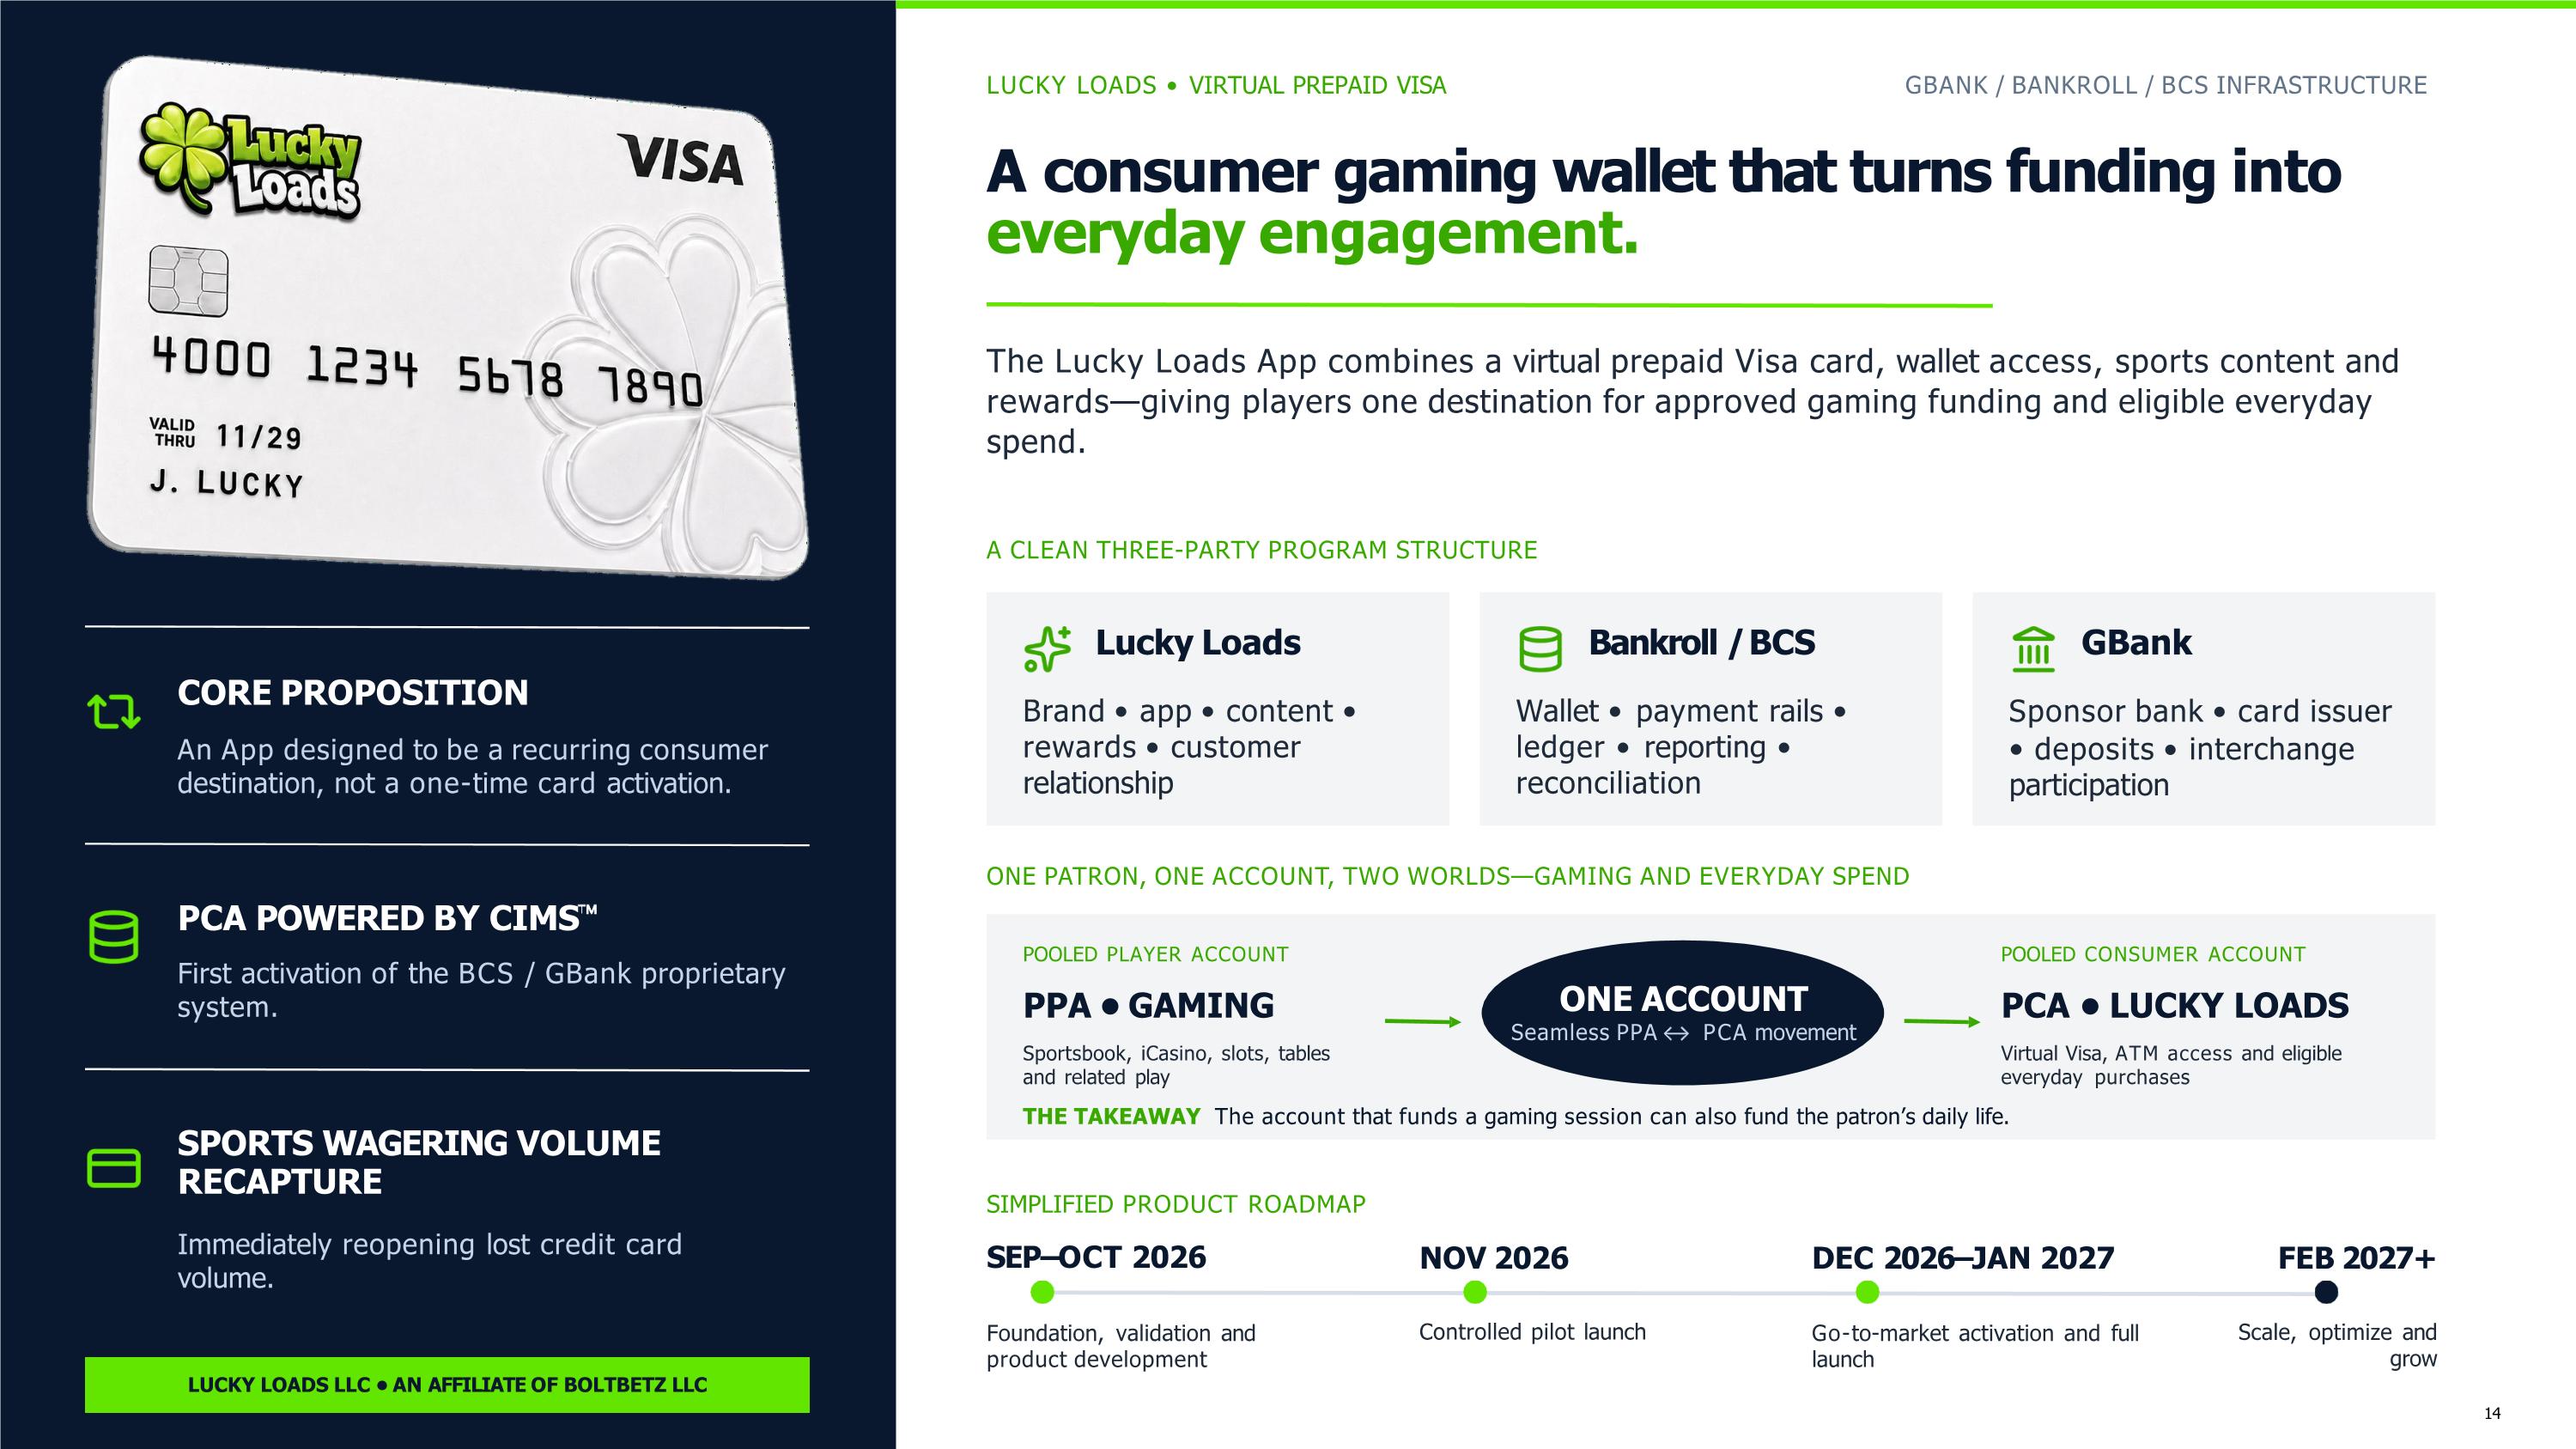
CORE PROPOSITION An App designed to be a recurring consumer destination, not a one-time card activation. PCA POWERED BY CIMS First activation of the BCS / GBank proprietary system. SPORTS WAGERING VOLUME RECAPTURE Immediately reopening lost credit card volume. LUCKY LOADS LLC • AN AFFILIATE OF BOLTBETZ LLC LUCKY LOADS • VIRTUAL PREPAID VISA GBANK / BANKROLL / BCS INFRASTRUCTURE A consumer gaming wallet that turns funding into everyday engagement. The Lucky Loads App combines a virtual prepaid Visa card, wallet access, sports content and rewards—giving players one destination for approved gaming funding and eligible everyday spend. A CLEAN THREE-PARTY PROGRAM STRUCTURE Lucky Loads Brand • app • content • rewards • customer relationship Bankroll / BCS Wallet • payment rails • ledger • reporting • reconciliation GBank Sponsor bank • card issuer deposits • interchange participation ONE PATRON, ONE ACCOUNT, TWO WORLDS—GAMING AND EVERYDAY SPEND POOLED PLAYER ACCOUNT PPA • GAMING Sportsbook, iCasino, slots, tables and related play ONE ACCOUNT Seamless PPA PCA movement POOLED CONSUMER ACCOUNT PCA • LUCKY LOADS Virtual Visa, ATM access and eligible everyday purchases THE TAKEAWAY The account that funds a gaming session can also fund the patron’s daily life. SIMPLIFIED PRODUCT ROADMAP SEP–OCT 2026 Foundation, validation and product development NOV 2026 Controlled pilot launch DEC 2026–JAN 2027 Go-to-market activation and full launch FEB 2027+ 14 Scale, optimize and grow
SECTION A Appendix Detailed portfolio, credit-quality and non-GAAP reconciliation information. 15
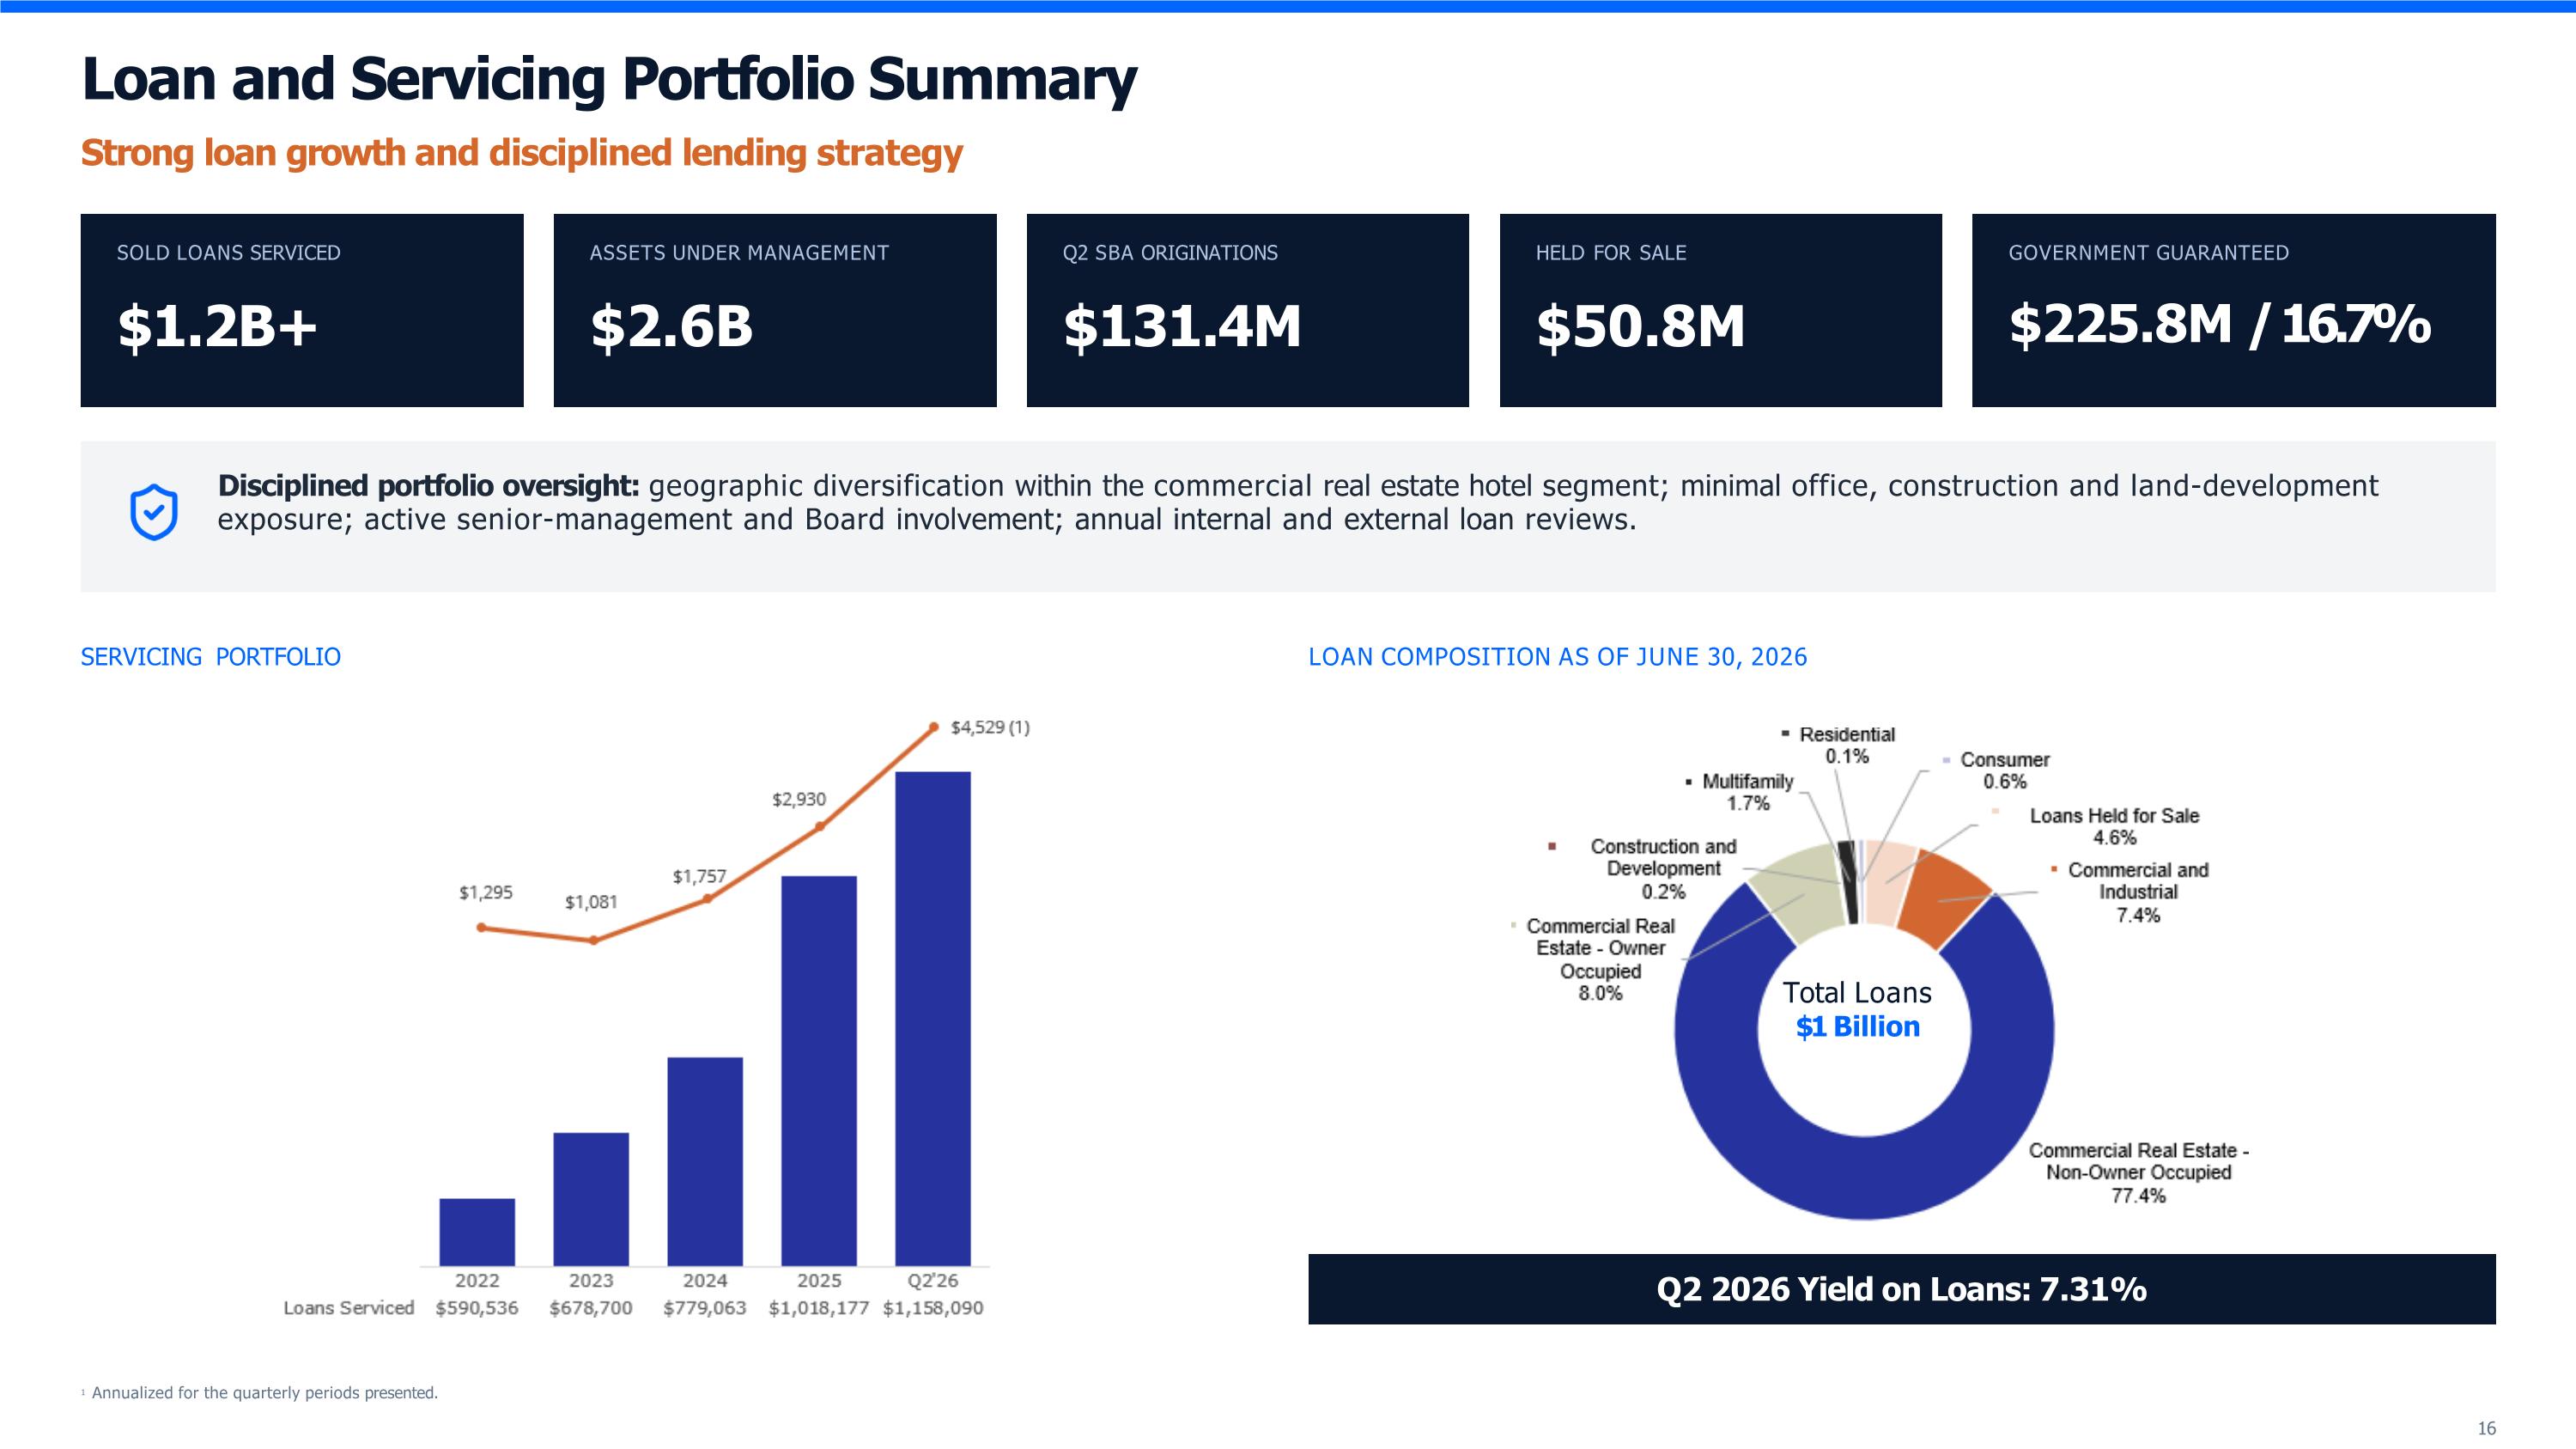
Loan and Servicing Portfolio Summary Strong loan growth and disciplined lending strategy SOLD LOANS SERVICED $1.2B+ ASSETS UNDER MANAGEMENT $2.6B Q2 SBA ORIGINATIONS $131.4M HELD FOR SALE $50.8M GOVERNMENT GUARANTEED $225.8M / 16.7% Disciplined portfolio oversight: geographic diversification within the commercial real estate hotel segment; minimal office, construction and land-development exposure; active senior-management and Board involvement; annual internal and external loan reviews. SERVICING PORTFOLIO LOAN COMPOSITION AS OF JUNE 30, 2026 Total Loans $1 Billion 16 Q2 2026 Yield on Loans: 7.31% 1 Annualized for the quarterly periods presented.
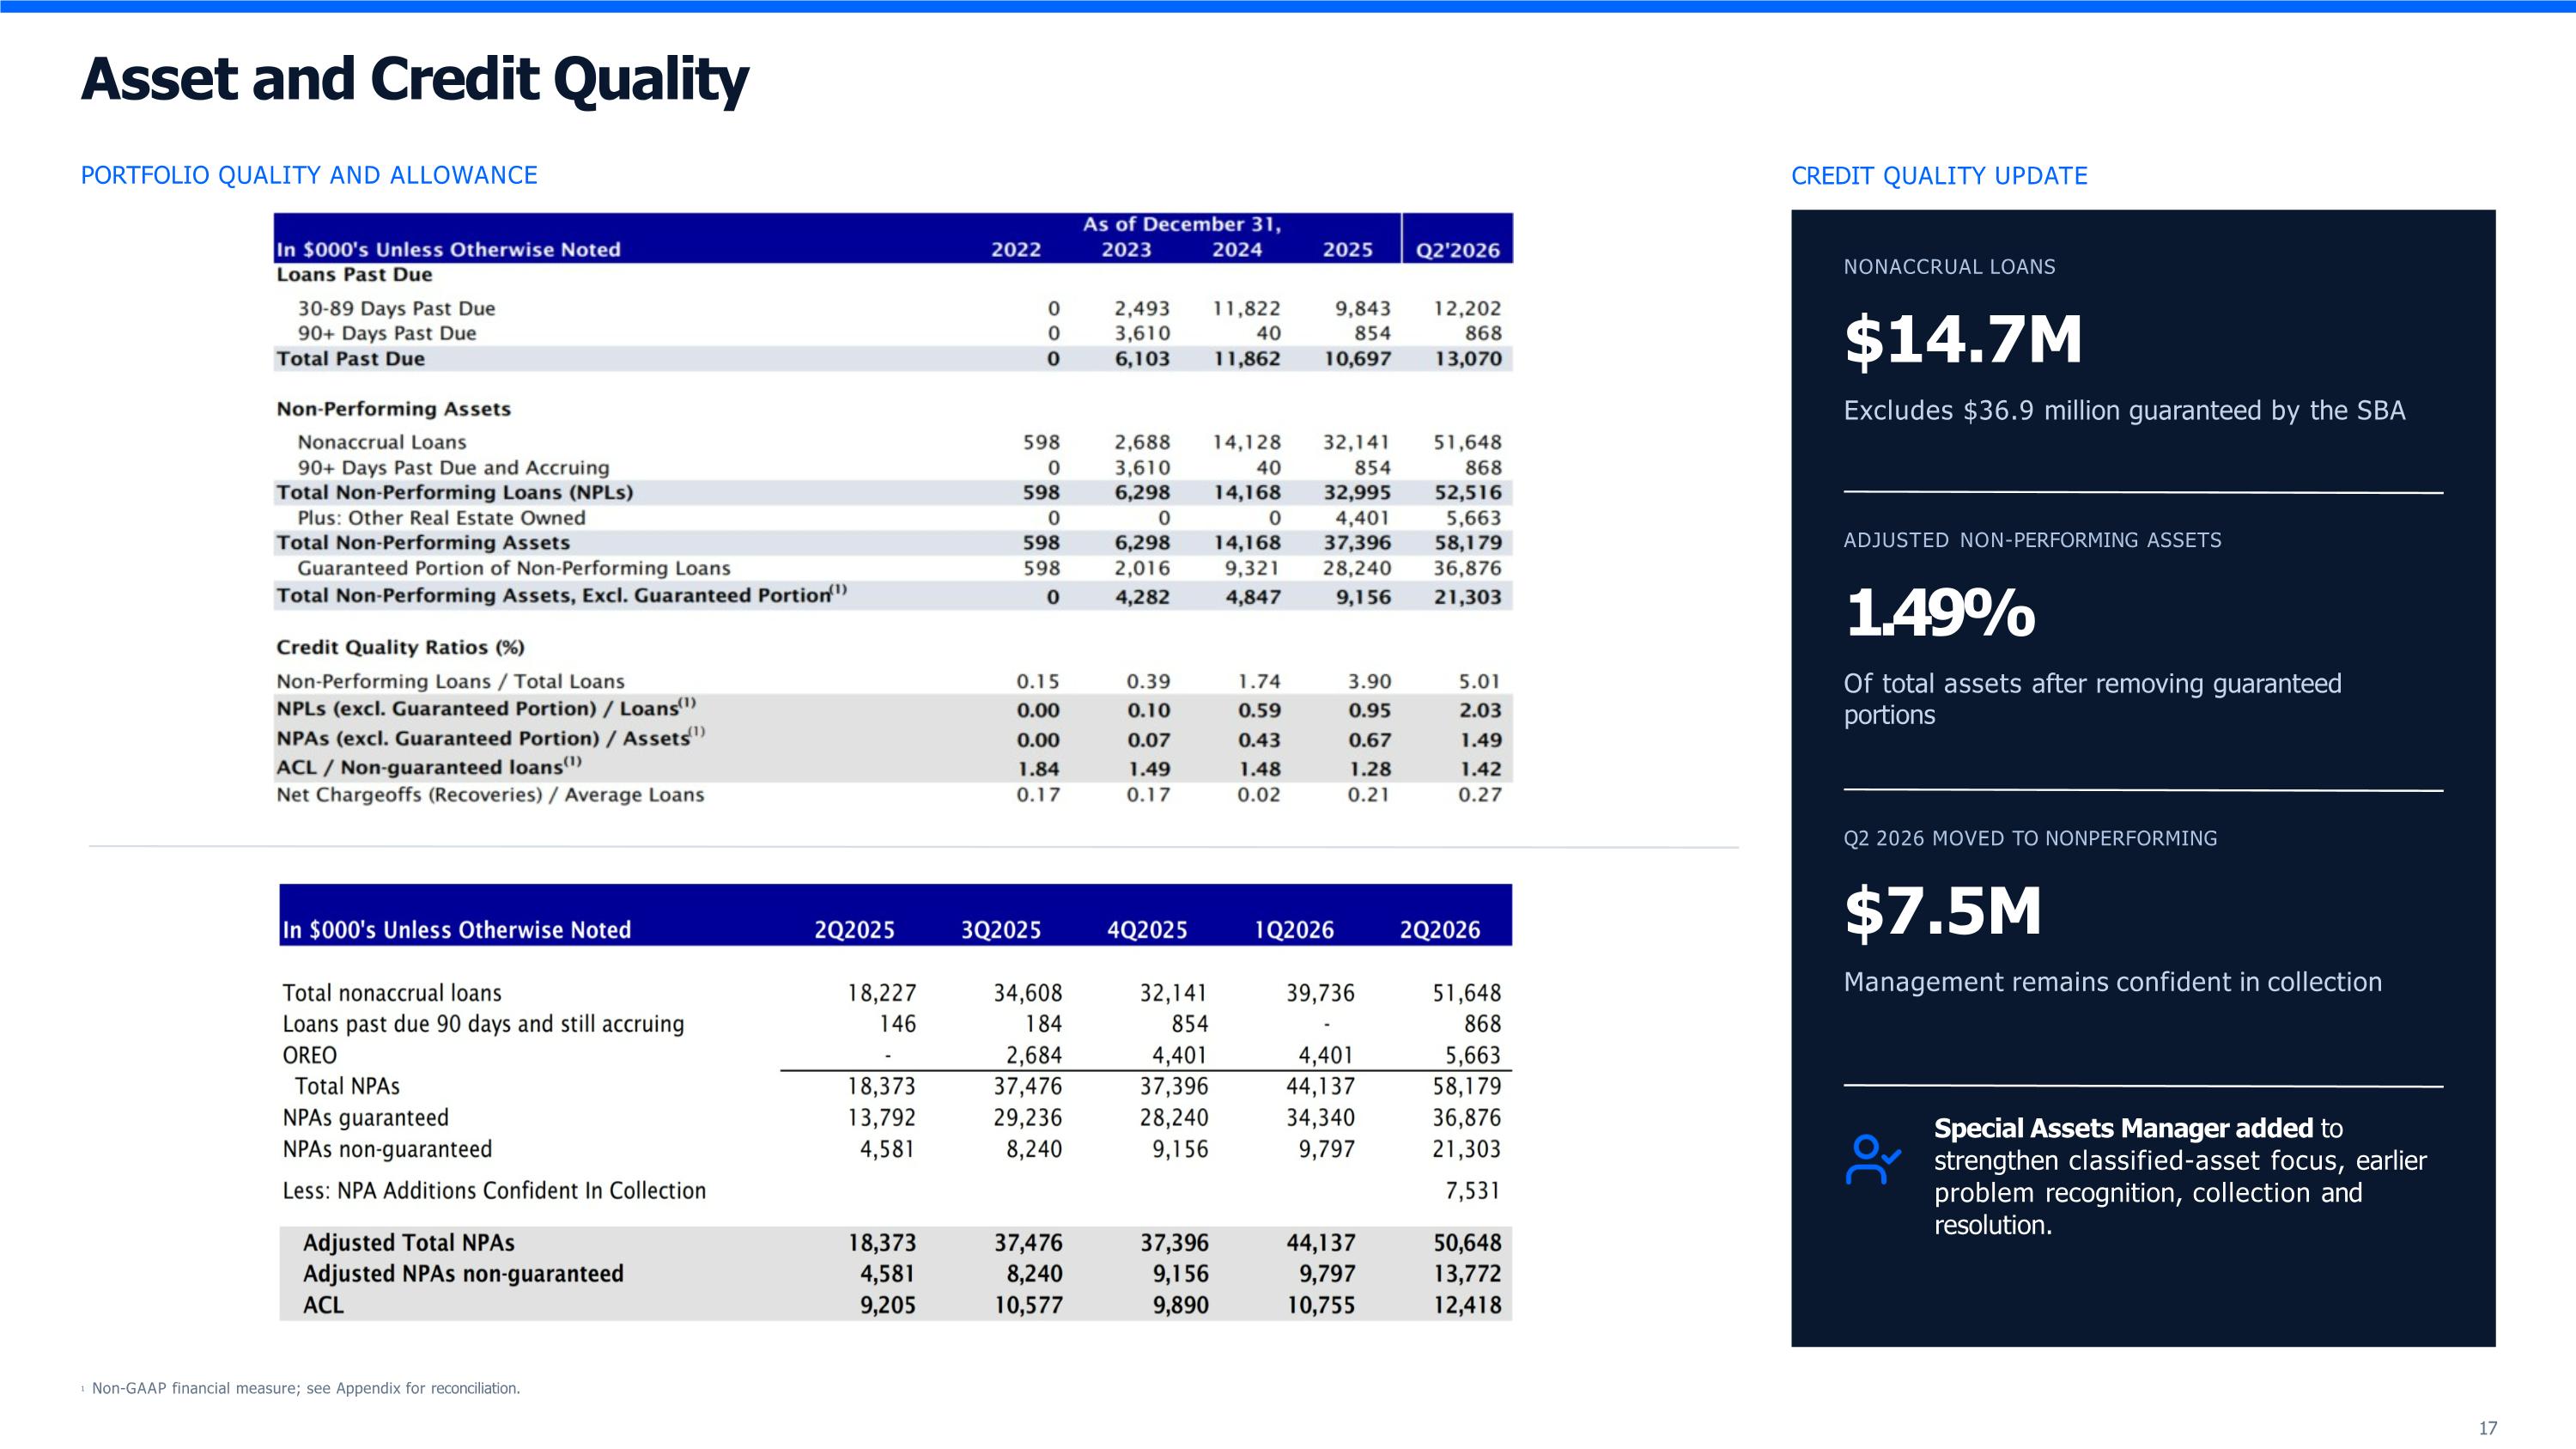
Asset and Credit Quality PORTFOLIO QUALITY AND ALLOWANCE CREDIT QUALITY UPDATE NONACCRUAL LOANS $14.7M Excludes $36.9 million guaranteed by the SBA ADJUSTED NON-PERFORMING ASSETS 1.49% Of total assets after removing guaranteed portions Q2 2026 MOVED TO NONPERFORMING $7.5M Management remains confident in collection Special Assets Manager added to strengthen classified-asset focus, earlier problem recognition, collection and resolution. 1 Non-GAAP financial measure; see Appendix for reconciliation.
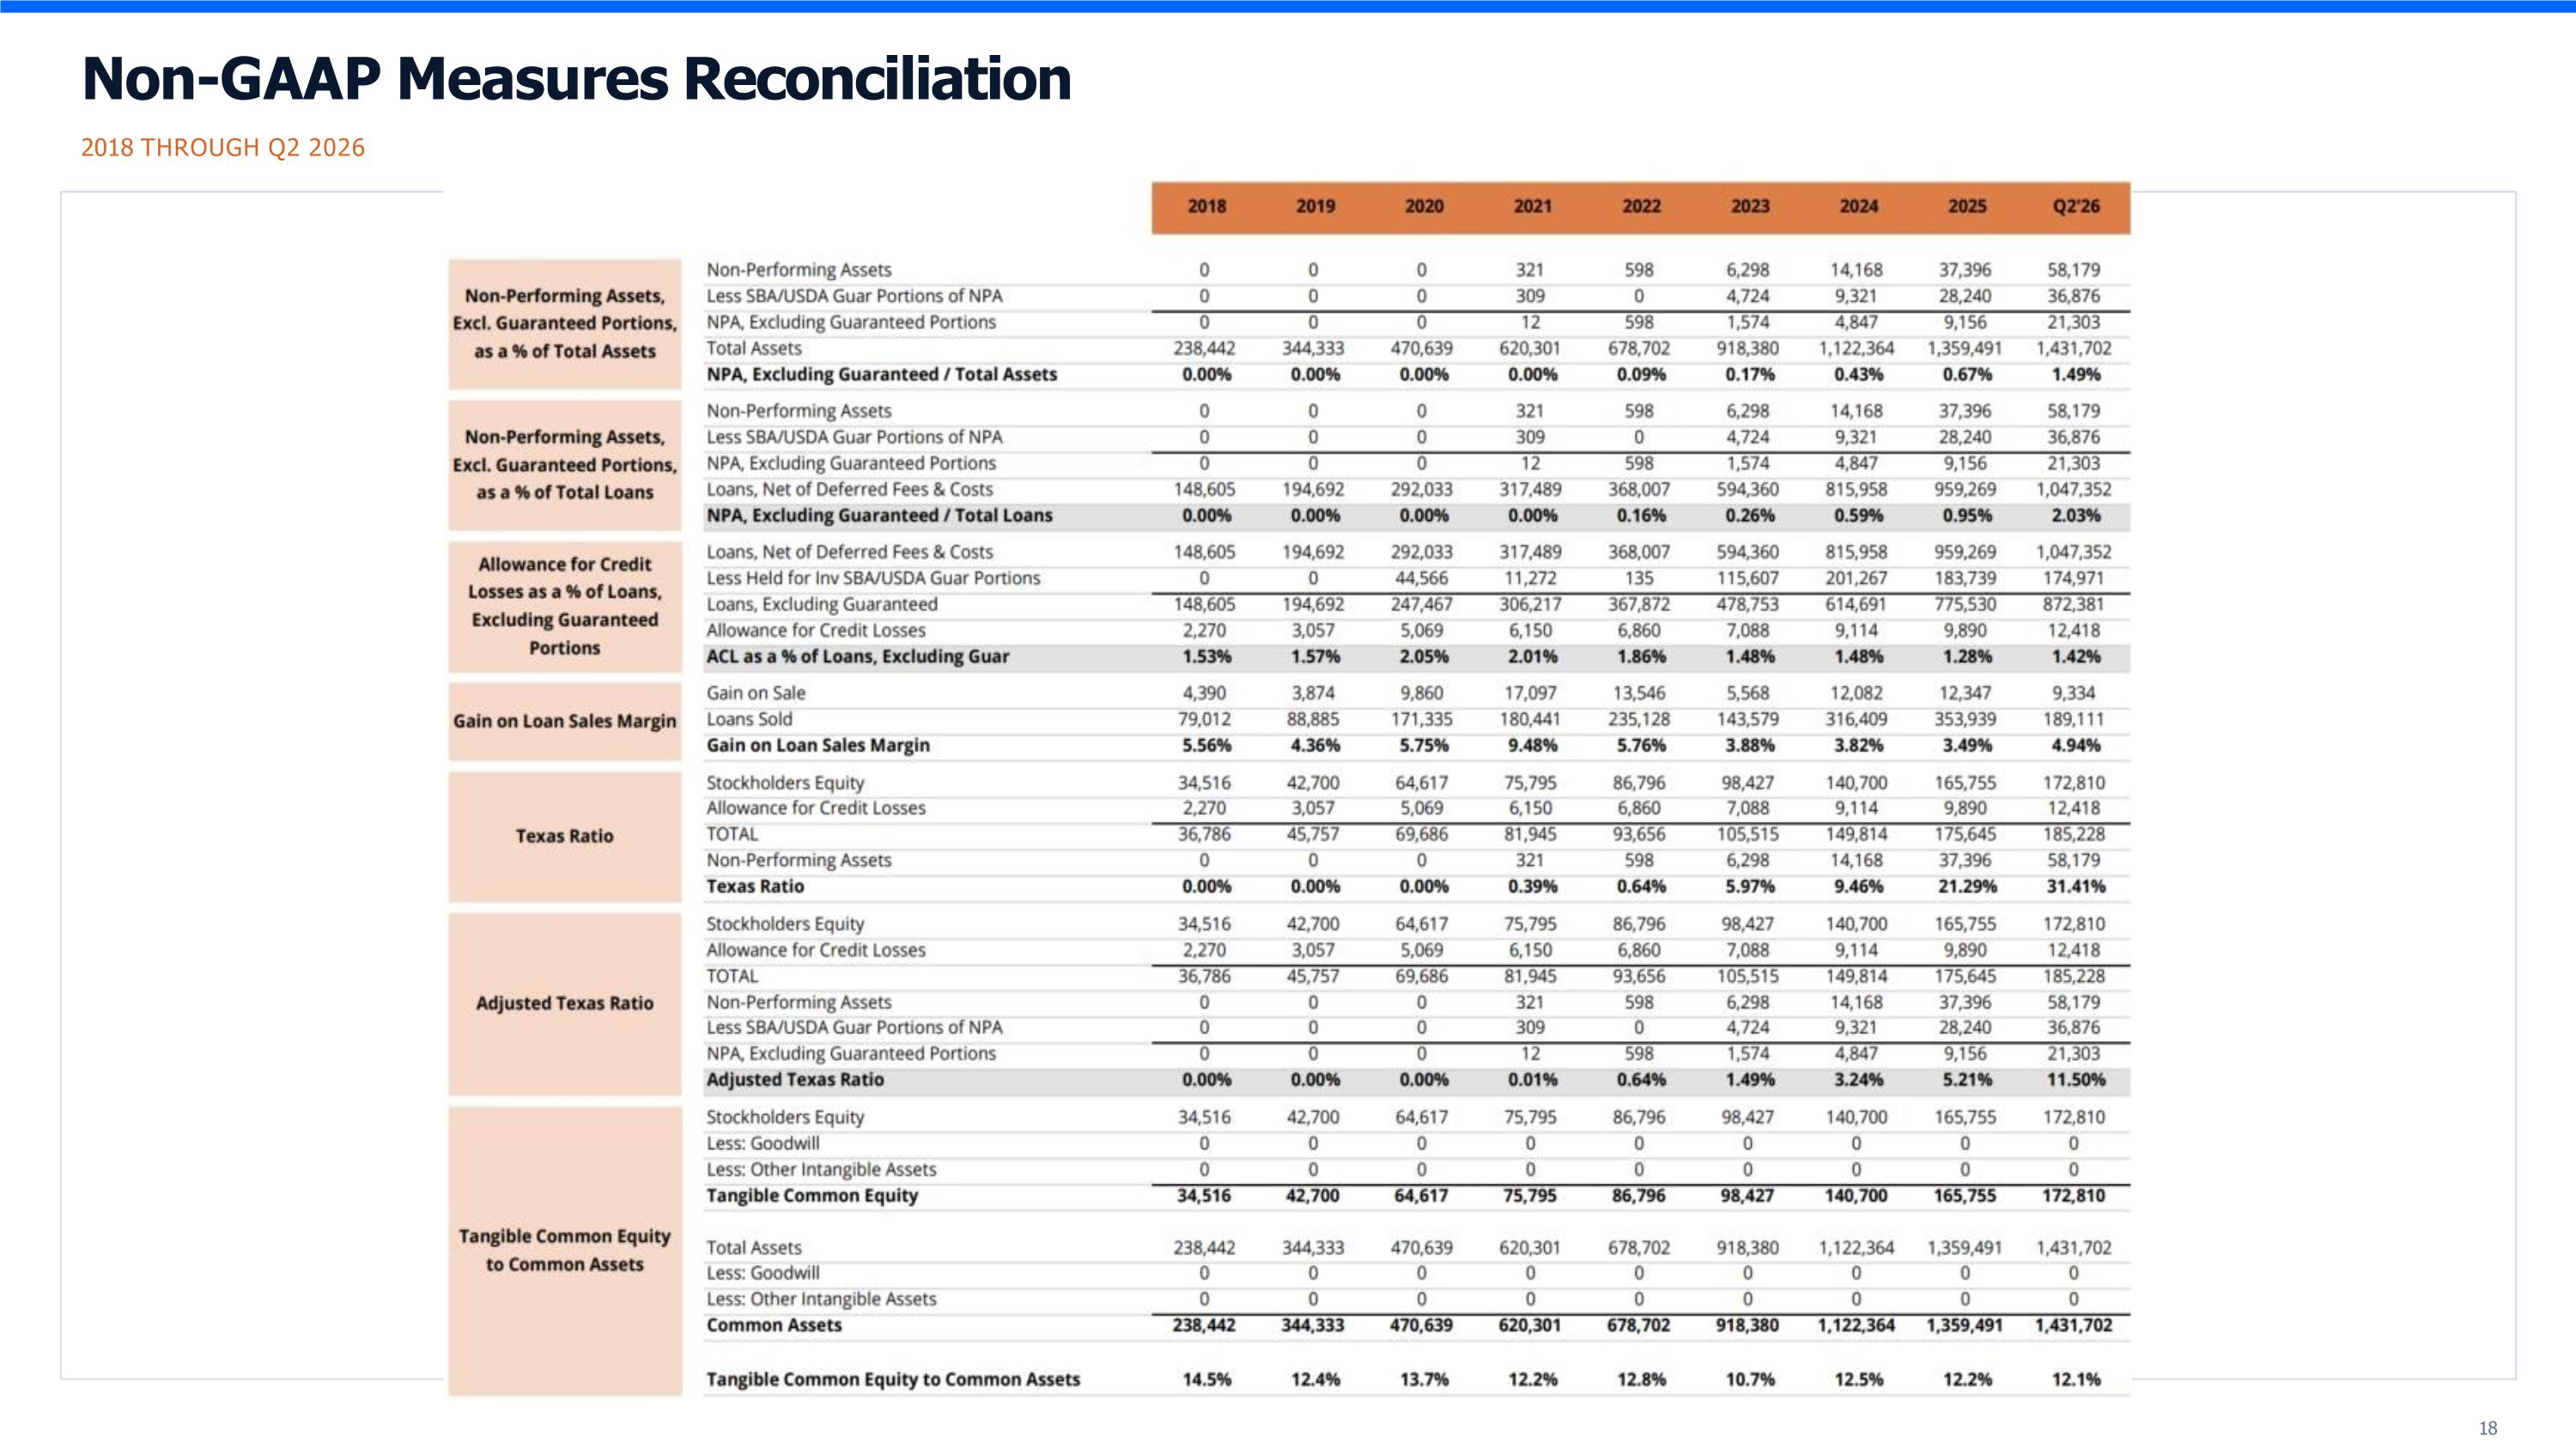
Non-GAAP Measures Reconciliation 2018 THROUGH Q2 2026
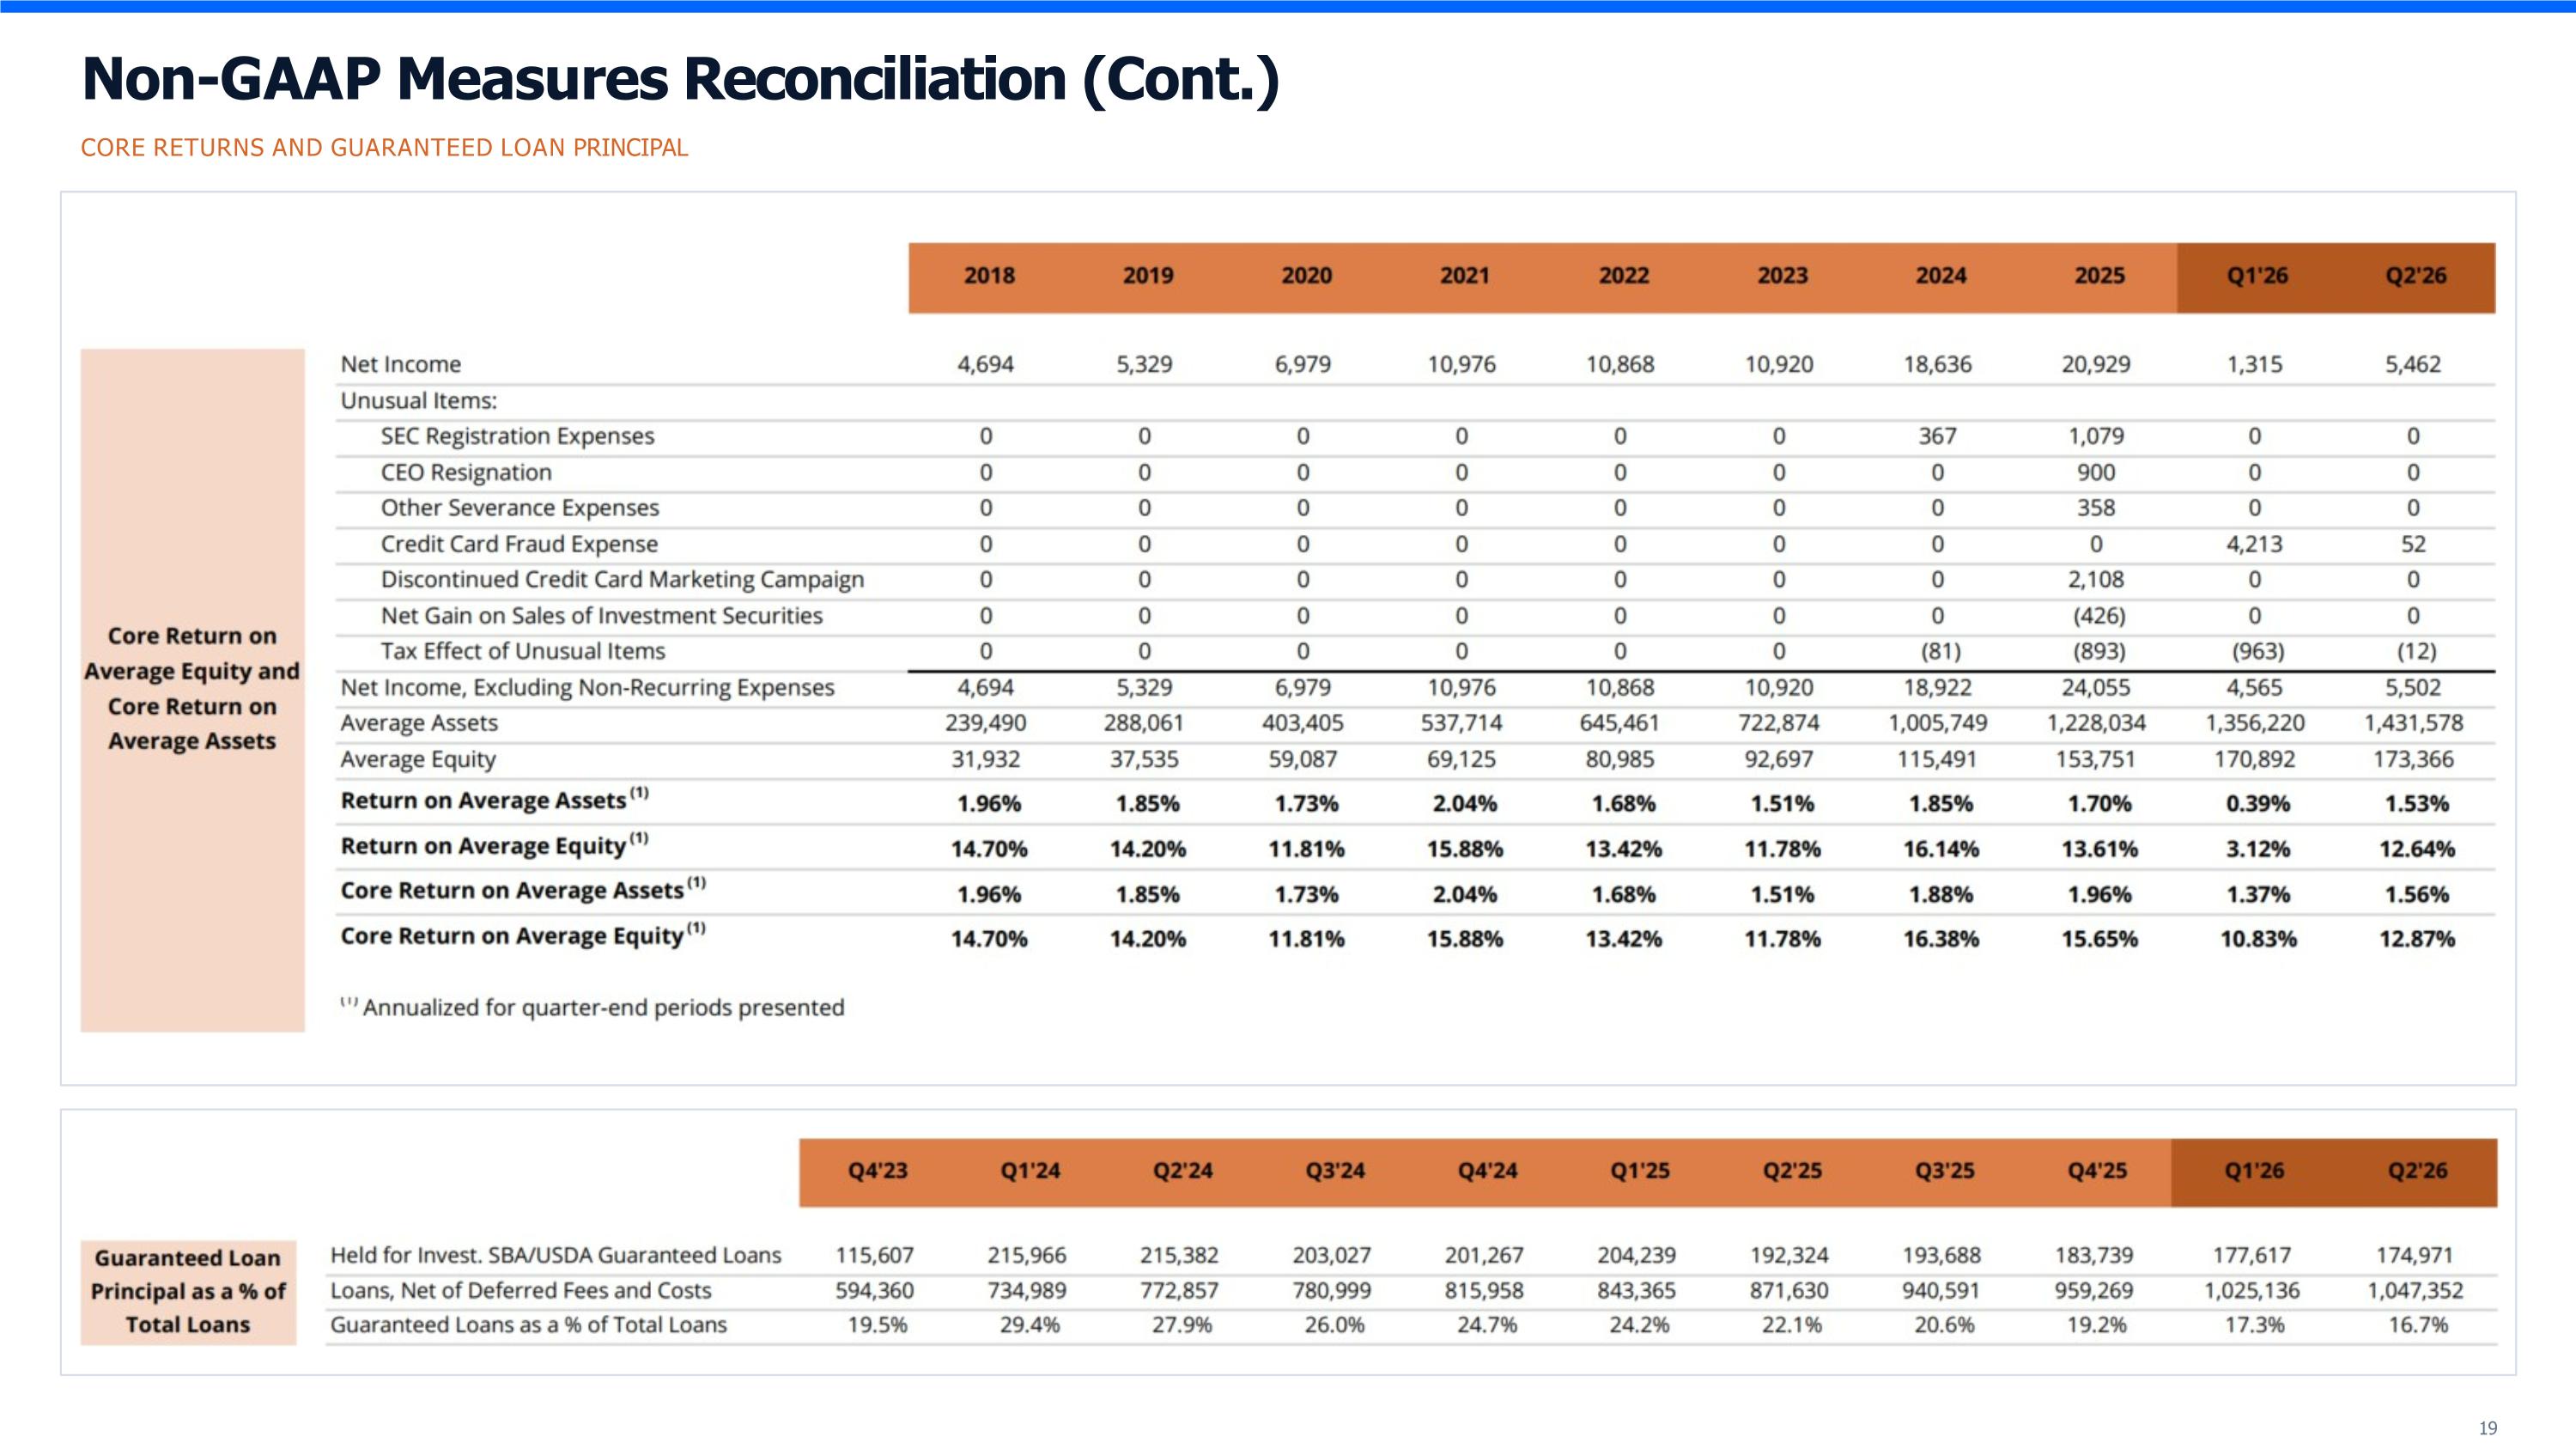
Non-GAAP Measures Reconciliation (Cont.) CORE RETURNS AND GUARANTEED LOAN PRINCIPAL
Thank You! 20